How to Add a Grid to a Graph Plot in Matplotlib with Python

In this article, we show how to add a grid to a graph plot in matplotlib with Python.
So, by default, in matplotlib, plots do not contain grid lines in the background.
However, if we want, we can add a grid to graph, we can.
So to add a grid to a graph in matplotlib, we create axes, such as through the line, axes= axes.plt()
After we do this, then we call the grid() function on axes by the following line, axes.grid()
This will create grid lines in the graph.
The following code creates grid lines in the background of the
function, y= x2
So let's break down this code.
We first import matplotlib.pyplot as plt. This allows us to reference the plot as plt.
We then import numpy as np. So we reference the numpy module as np.
We creates an axes for the plot with the line, axes= plt.axes()
We then create the values for the x-axis in the variable, x
We then plot x2 with the plt.plot() function.
To create grid lines on the graph, we do so with the line, axes.grid()
We then show the plot with the line, plt.show()
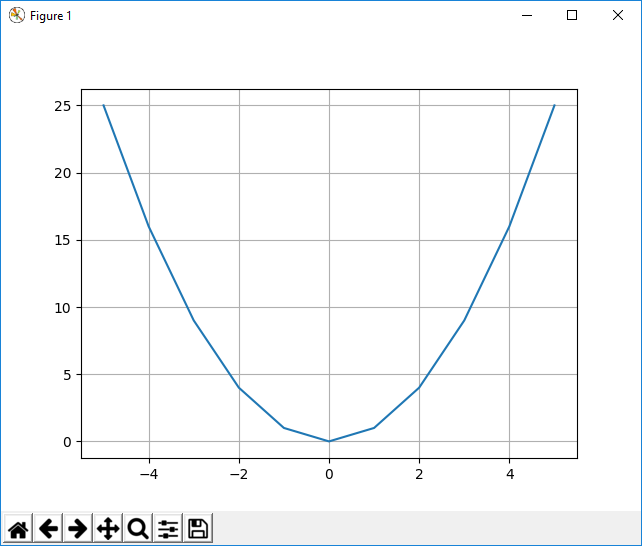
Running the following code above, we get the following output shown below.

Now we can see a graph plot that has a grid.
And this is how to add a grid to a graph plot in matplotlib with Python.
Related Resources
How to Randomly Select From or Shuffle a List in Python
