
How to Add a Title to a Graph in the Bokeh Module in Python

In this article, we show how to add a title to a graph in the bokeh module in Python.
We can not only add a title, but we can customize the color of the text of the title, as well as the location of the title on the graph, and the font style such as italic, normal, bold, or bold italic.
Bokeh is a module in Python that allows for the visualization of data, shown in forms such as graphs.
So, in this example, we will plot a basic line on a graph. You will then add the title, "Line of 2x+1". We will make the font "times", the color "orange", and a bold font style.
This is shown in the code below.
So the first thing we have to do is import the bokeh module.
We import figure, output_file, and show from bokeh.plotting.
We create a variable, fig1, and use the figure() function to construct the graph. We make the plot_width 500px and the plot_height 400px. In this same figure() function, we add the title attribute and set it equal to, "Line Graph of 2x+1". Since we want the title on top of the graph, we add the title_location attribute and set it equal to, "above"
The title_location attribute can accept 1 of 4 attributes: "above", "below", "left", and "right".
If you want the title on the top of the graph, you use "above". If you want the title on the bottom of the graph, you use "below". If you want the title on the left side of the graph, you use "left". If you want the title on the right side of the graph, you use "right".
This is all that goes into the figure() function regarding the title. If you want to add other title attributes, this is done outside of the figure() function.
To make the title a different color, we call the name of the figure and set the title.text_color attribute to that color. In this case, it is orange.
To make the title a different font style, we call the name of the figure and set the title.text_font_style attribute to either "normal", "italic", "bold", or "bold italic". In this example, we set this attribute to "bold".
When we run the above code, we get the following output below.
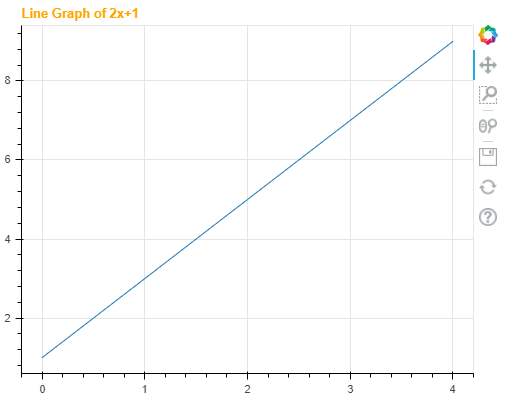
You can see that the graph appears on top of the graph. And the title is
in bold with an orange color.
And this is how we can add a title to a graph in the bokeh module in Python.
Related Resources
How to Extract All Files and Folders from a Zip File in Python
How to Read the Contents of a Zip File in Python