
How to Change the Line Width of a Graph Plot in Matplotlib with Python

In this article, we show how to change the line width of a graph plot in matplotlib with Python.
So when you create a plot of a graph, by default, matplotlib will have the default line width set (a line width of 1).
However, this line width can be adjusted.
Matplotlib allows you to adjust the line width of a graph plot using the linewidth attribute.
By default, linewidth=1
If you want to make the line width of a graph plot thinner, then you can make linewidth less than 1, such as 0.5 or 0.25.
If you want to make the line width of the graph plot thicker, then you can make linewidth greater than 1. This thickens the graph plot.
In the following code shown below, we show how to change the line width of the graph plot
in matplotlib with Python.
So the first thing we have to do is import matplotlib. We do this with the line, import matplotlib.pyplot as plt
We then create a variable fig, and set it equal to, plt.figure()
This creates a figure object, which of course is initially empty, because we haven't populated it with anything. We then add axes to this figure. We then have our x coordinates that range from 0 to 10.
We then plot the square of the x coordinates.
It is with the plot() function that we specify the line width of the plot. We do this with the linewidth attribute. In this case, we set the line width equal to 10, giving the line of the graph plot a thickness 10 times the value of the default line width.
If you want to make the graph plot have a very thin line width, you would give the linewidth attribute a low value such as 0.1 or 0.5, for example.
Lastly, we show the figure with the show() function.
This works if you're using a python IDE other than jupyter notebooks. If you are using jupyter notebooks, then you would not use, plt.show(). Instead you would specify in the code right after importing matplotlib, %matplotlib inline
This line allows the figure of a graph to be shown with jupyter notebooks.
After running the following code above, we get the following figure with the
line width of the graph plot being very thick (10 times the default value) shown
in the image below.
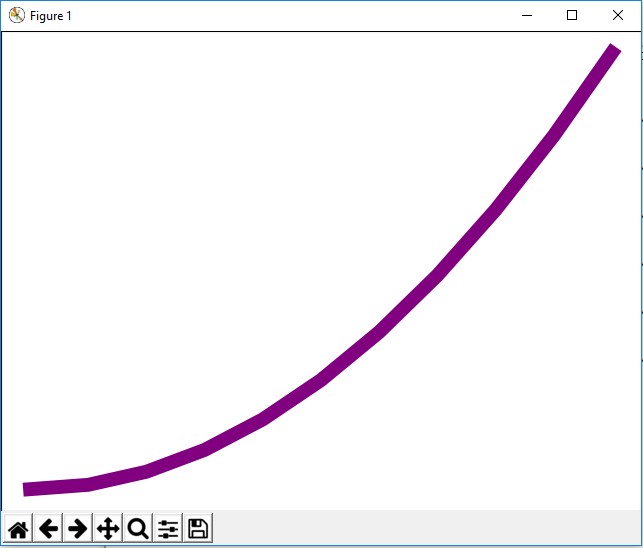
So now you see a figure object with a graph plot with a thickened line width.
And this is how you can change the line width of a graph plot in matplotlib with Python.
Related Resources
How to Randomly Select From or Shuffle a List in Python