
How to Create a Box Plot in Seaborn with Python

In this article, we show how to create a box plot in seaborn with Python.
A box plot (also called a whisker diagram) is a plot that reveals several different types of data.
A box plot is composed of a summary of 5 different data points: the minimum, first quartile, median, third quartile, and maximum.
The minimum is the lowest end of the range of values.
The first quartile is where the first 25% of the values lie.
The third quartile is first 75% of the values.
The maximum is the highest end of the range of values.
The box plot is also called the box and whisker diagram because it is composed of a box and whiskers. The box is composed of the first quartile to the third quartile. The lower whisker extends to the minimum of the values. The upper whisker extends to the maximum of the values.
In seaborn, you will also see outlier points on the diagram, normally represented by diamonds (or some other shapes).
In the following code below, we create a box plot based off of the
built-in tips data set of seaborn. We create a box plot of the day of the week as the
x-axis and the total_bill as the y-axis.
By convention, we import seaborn as sns.
In order to see the graph within the editor, we put in the statement, %matplotlib inline
You put this statement in if you are using an editor such as jupyter notebooks so that you can see the graph output in the editor.
Seaborn already has built-in data sets.
One data set that can be used is tips.
We import this dataset with the line, tips=sns.load_dataset('tips')
We then output the contents of tips using tips.head() You can see that the columns are total_bill, tip, sex, smoker, day, time, and size.
We then create a box plot with the day column as the x data and the total_bill as the y data. The data set is the tips data set.
This plots out the following box plot shown below.

So you can see based off of the box plots that the x data are the days of the week and the y data is the total_bill.
Box plots show range, median values, and outliers, along with quartile data.
Saturdays have the most expensive and the cheapest meals. You can see on Saturday that the lower whisker is the lowest of all other days. And you can see that the outliers present on Saturdays go the highest.
Box plots can be very useful for visualizing data. We can see median values. Even though Saturdays have the largest range, it still has a lower median value than Sundays; Sundays, on average, is the most expenive day. Fridays, out of all days, has the lowest median value.
We can also add a hue to a box plot in seaborn.
A hue adds split data so we can see side-by-side comparison of a category.
Sex can be 1 of 2 things: male or female.
When we add the line, hue='sex', we are able to see the side-by-side comparison of males vs females in the box plot regarding the total_bill for each day of the week.
This is shown in the following box plot below.
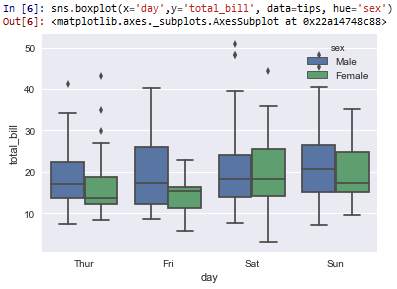
So now you see the side-by-side comparison of males vs females
when plotting the day of the week against the total_bill.
And this is how to create a box plot in seaborn with Python.
Related Resources
How to Randomly Select From or Shuffle a List in Python