
How to Create a Graph with Pylab in Python

In this article, we show how to create a graph with Pylab in Python.
Python has a module named Matplotlib, which is capable of creating plotting graphs. Pylab is a module in matplotlib that gets installed alongside matplotlib.
For example, if you have x-coordinates and corresponding y-coordinates, you can plot these coordinates on a graph to make a mathematical graph of the coordinates.
We will demonstrate this below.
But before we get to the code and the images of the mathematical plots, we first need to install the Matplotlib module.
To do this, open up the command prompt on your computer and specify the full path to Scripts folder in the Python package you downloaded. Then, after this type in, pip install Matplotlib.
The Matplotlib module should then download. Once it has been successfully installed, then we're ready to proceed.
So, to begin with, in our first example, we will plot x-
and y-coordinates that form a straight line.
First Example
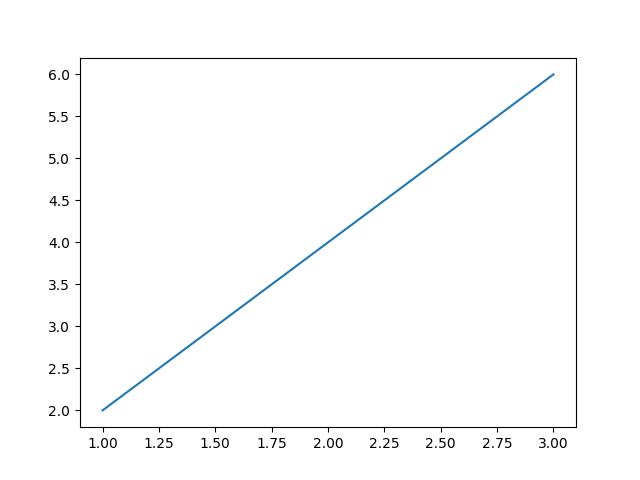
So, in the first example, we plot the x-coordinates of 1,2,3 and we plot the corresponding y-coordinates of 2,4,6.
We then show the graph.
The code to plot these coordinates is shown below.
So, the first thing we must do is import pylab.
After this, from pylab, we must import plot and show.
plot is the function to plot the coordinates on the graph and the show() function is to show the graph at the end.
After this, we specify our x- and y-coordinates. The x-coordinates are [1,2,3] and the y-coordinates are [2,4,6].
We then use the plot() function to plot the x- and y-coordinates.
The plot() function simply plots the coordinates on a graph but does not show it. To show the graph, we have to call the show() function.
This creates the following graph shown below.
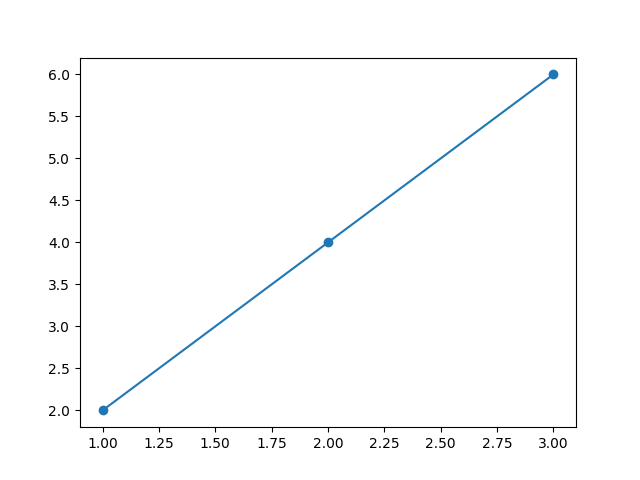
If you want to add a marker to each point that you plot, then
you could modify the plot() function above to the following shown below.
So running the code now with this modification produces the
following shown below.
Second Example
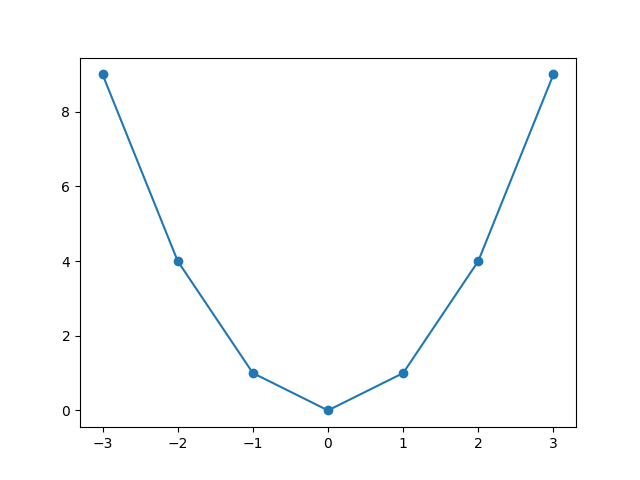
As a second example, we will plot a parabola.
The x-coordinates are [-3,-2,-1,0,1,2,3]
The y-coordinates are [9,4,1,0,1,4,9]
The full code to plot the graph is shown below.
So, this produces the following graph, which is shown below.
Related Resources
How to Randomly Select From or Shuffle a List in Python