
How to Create a Histogram with Distplot in Seaborn with Python

In this article, we show how to create a histogram with distplot in seaborn with Python.
Seaborn is a module in Python that is built on top of matplotlib that is designed for statistical plotting.
Seaborn can create all types of statistical plotting graphs.
One of the plots that seaborn can create is a histogram.
A countplot is kind of likea histogram or a bar graph for some categorical area. It simply shows the number of occurrences of an item based on a certain type of category.
So in the following code below, we show how to create
a countplot based on a
category.
By convention, we import seaborn as sns.
In order to see the graph within the editor, we put in the statement, %matplotlib inline
You put this statement in if you are using an editor such as jupyter notebooks so that you can see the graph output in the editor.
Seaborn already has built-in data sets.
One data set that can be used is tips.
We import this dataset with the line, tips=sns.load_dataset('tips')
We then output the contents of tips using tips.head() You can see that the columns are total_bill, tip, sex, smoker, day, time, and size.
We then create a histogram of the total_bill column using distplot() function in seaborn.
This plots out the total_bill column, which is shown below.
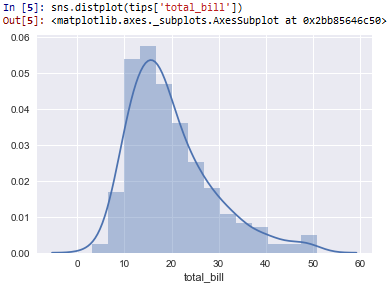
So based on this histogram, you can see that the majority of the total bills are in the range of $10-$20, with some meals costing as little as $5 and others costing as much as $50.
Also notice that when you have the line, sns.distplot(tips['total_bill']), a histogram is shown with a graph of the kernel density estimation (kde).
The kernel desnity estimation (kde) is a way of smoothing data to show estimated data.
You may want to show the kde or you may not want to.
By default, kde= True, showing the kde
To not display (leave out) the kde, you would specify the statement, kde=False
This is shown in the following code below.
So now we have the same code as before but now with the statement, kde=False
This produces a histogram without the kde shown, as seen below.
And this is how to create a histogram with the displot() function in
seaborn with Python.
Related Resources
How to Randomly Select From or Shuffle a List in Python