
How to Create a Pie Chart in Matplotlib with Python

In this article, we show how to create a pie chart in matplotlib with Python.
So there are several different types of charts or graphs you can make in matplotlib, including line plots, bar graphs, histograms, pie charts, scatter plots, etc.
A pie chart is a diagram that shows a whole unit and the percentage that each constituent of the whole consists of.
A pie chart is a common chart that is used to represent data and is familiar to most people.
In the following code below, we create a pie chart composed of certain
expenses, including a mortgage, utilities, gas, and food. We create a pie chart so that
we add our custom colors and we add the percentages that each part takes up.
So the first thing we have to do is import matplotlib. We do this with the line, import matplotlib.pyplot as plt
We then create a variable, labels, and set it each of the labels that we want. This is done with the line, labels= ['Mortgage', 'Utilities', 'Food', 'Gas']
These are the constituents of the pie chart.
We then create a variable called colors and we set each of the colors of each of the constitutents of the pie chart.
We then set the sizes of each of the constituents.
All of this has to be ordered and matched up.
So the mortgage will be $1500.
The utilities will be $600.
The food will be $500.
The gas will be $300.
We then plot the pie chart using the plt.pie() function.
The sizes function as the numerical data.
We then add labels with the statement, labels=labels
We then add in our custom colors with the statement, colors=colors
The statement, startangle=90, makes the plotting right at the top middle of the pie chart. The first elements are then plotted and the next sequential elements are plotted in a counterclockwise direction.
To add percentages to each of the constitutents of the pie chart, we add in the line, autopct='%1.1f%%', to the plt.pie() function.
This formats the percentage to the tenth place.
If you want to format the percentage to the hundredths place, you would use the statement, autopct='%1.2f%%'
If you want to format the percentage to the thousandths place, you would use the statement, autopct='%1.3f%%'
By default, matplotlib creates pie charts with a tilt. If you want to remove this tilt, then you can specify the line, plt.axis('equal')
This gets rid of the tilt from the pie chart.
We then show the plot using the plt.show() function.
This produces the following pie chart shown below.

So you can see above that we have a beautiful pie chart that has our custom colors and is labeled with percentages.
Now there's one last thing we can do to a pie chart.
We can create separate spacing between the different constituents of the pie chart.
We do this with the explode attribute, which we can supply with a tuple of values.
The number of values is equal to the number of segments in the pie chart.
In this pie chart, there are 4 segments, or constituents. Therefore, for the explode () function, we have to specify 4 values.
This is shown in the following code below.
So we have everything the same as before but now we add the statement, shadow=True,explode=(0.1, 0.1, 0.1, 0.1), in the plt.pie() function.
What this does is it pulls each segment out from the whole pie chart.
Notice that there are 4 parameters, or arguments, to this explode attribute (which is expressed as a tuple)>
Each parameter corresponds to each particular segment of the pie chart in the order originally specified.
This means that the first parameter refers to the mortgage, the second is the utilities, the third is the food, and the fourth is the repairs.
Since we specify 0.1 for each of them, we pull each of them out by that amount.
We also added a shadow to the pie chart by the statement, shadow=True
Once we run the code, the following pie chart will be output.

Now you see a pie chart with all segments exploded out by 0.1
Let's do one more example with the same explode attribute but now let's just explode the first segment using the statement, explode=(0.1, 0.1, 0.1, 0.1)
With this code, we now get the following output shown below.
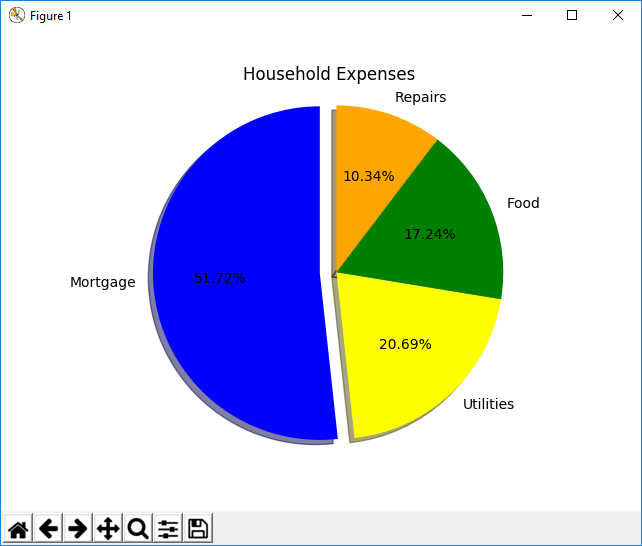
Now we just have one segment, the mortgage segment, exploded out.
And this is how to create a pie chart in matplotlib with Python.
Related Resources
How to Randomly Select From or Shuffle a List in Python