
How to Create a Poisson Probability Mass Function Plot in Python with the Numpy, Scipy, and Matplotlib Modules

In this article, we show how to create a poisson probability mass function plot in Python. To do this, we use the numpy, scipy, and matplotlib modules.
A poisson probability mass function is a function that can predict or show the mathematical probability of a value occurring of a certain data ponit.
Being that it is a probability mass function, it shows discrete data points.
If we look at this probability mass function plot, we can see what the probability is of a certain value occurring anywhere along the x-axis.
So let's say we have a graph of an x-axis with
Below we have the code that
creates a poisson probability mass function using numpy, scipy, and matplotlib.
So let's break down this code.
We first import poisson from scipy.stats
We then import the numpy module as np. This means that we reference the numpy module with the keyword, np.
We then import the matplotlib module plotting function because we are going to plot the data.
So we use the numpy module to create the x-axis data, we use scipy to create a poisson probability mass function, and then we use the matplotlib module to plot the data.
We create a variable, x, and assign it to, plt.plot(x, poisson.pmf(x,150))
What this line does is it creates an x-axis of values that range from 100 to 200 with increments of 0.5.
We then plot a poisson probability mass function with the line, plt.plot(x, poisson.pmf(x,150))
This creates a poisson probability mass function with a mean of 150.
We then show this graph plot with the line, plt.show()
After running this code, we get the following output shown below.
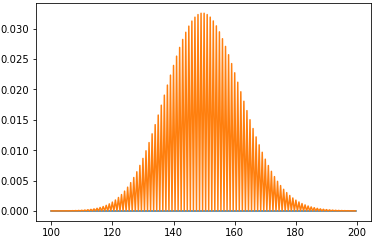
So you can see, from the graph, that the probability of 150 being the value is high, while the probability of an outlier such as 100 or 200 occurring is low.
And this is how to create a probability density function plot in Python with the numpy, scipy, and matplotlib modules.
Related Resources
How to Randomly Select From or Shuffle a List in Python