
How to Create a Rugplot in Seaborn with Python

In this article, we show how to create a rugplot in seaborn with Python.
A rugplot is a graph that places a dash horizontally with each occurrence of an item in a dataset.
Areas where there is great occurrence of an item see a greater density of these dashes.
Areas where there is little occurrence of an item see just occasional dashes.
This is the essence of a rugplot.
So we create a rugplot with the rugplot() function in seaborn and pass in a column of a data set.
A graph plot of this column will then be done.
So in the following code below, we create a rugplot of the tip column
of the built-in tips data set in seaborn.
By convention, we import seaborn as sns.
In order to see the graph within the editor, we put in the statement, %matplotlib inline
You put this statement in if you are using an editor such as jupyter notebooks so that you can see the graph output in the editor.
Seaborn already has built-in data sets.
One data set that can be used is tips.
We import this dataset with the line, tips=sns.load_dataset('tips')
We then output the contents of tips using tips.head() You can see that the columns are total_bill, tip, sex, smoker, day, time, and size.
We then create a rugplot of the tip column using rugplot() function in seaborn.
This plots out the tip column, which is shown below.
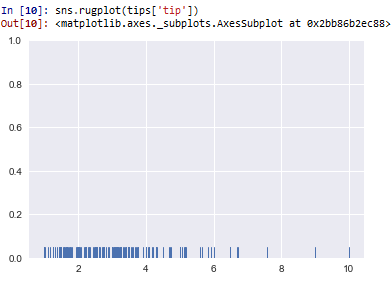
So based on this histogram, you can see that the majority of the tips given are roughly between $1.50 and just under $4.
You see the occasional tip at $9 and $10. But the majority are in the $1.50-$4 range.
So you can see how rugplots gives vertical lines horizontally across to plot data.
Areas where there is great occurrence has great density because the lines are stacked up on each other, giving a thicker appearance.
And this is how to create a rugplot in seaborn with Python.
Related Resources
How to Randomly Select From or Shuffle a List in Python