
How to Display an OpenCV Image in Python with Matplotlib

In this article, we show how to display an OpenCV image in Python with the matplotlib module.
OpenCV is a powerful, versatile module that allows us to do many computer vision tasks, including working with images.
Opening an image in OpenCV is as simple as using the cv2.imread() function, in which inside this function you provide the path to the image you want to display.
Let's say that we have the following image of a tropical tree shown at the following link: Tropical Tree.
To load and display this image using OpenCV, we can use the following
code shown.
Running the code above will get us the image shown below.

Now let's slightly modify this code so that we load the image in with OpenCV using the imread() function but then we display the image with matplotlib.
Below is how the code changes.
Running the code above gives us the image below.
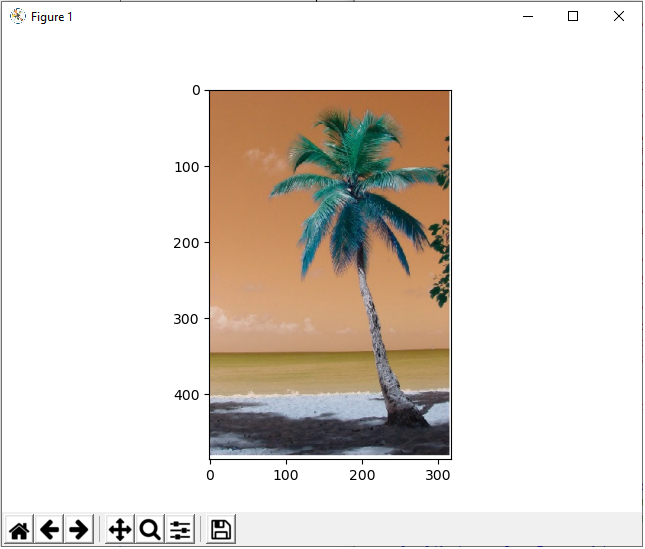
So we see that there is an obvious color disturbance between the original image and the one displayed using the matplotlib module.
The reason this occurs is because OpenCV renders images in the order of GBR, the reverse of the usual RBG format. This is the reason the colors get messed up from OpenCV to matplotlib. The matplotlib module displays images according to the more conventional RGB method.
Therefore, in order to correctly render images from OpenCV in matplotlib, what we need to do is convert the GBR image into a RGB image. Then matplotlib can display the image just as the original image.
To do this, we have the following code shown below.
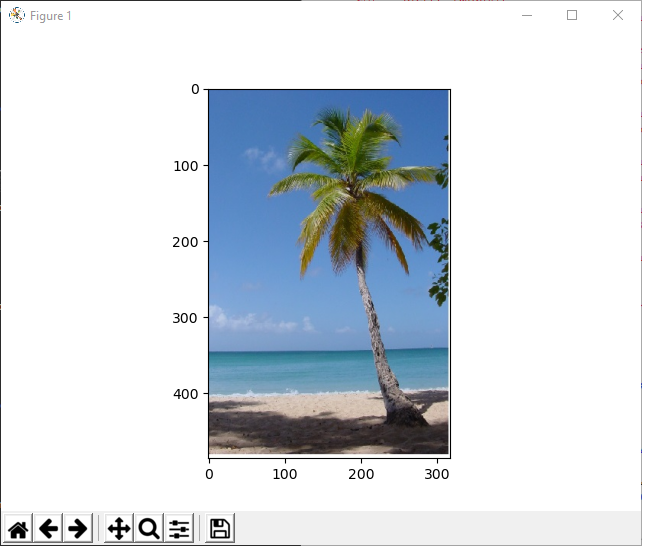
With the cv2.cvtColor() function, we are able to change the color code that matplotlib will render the image. We change the color code from BGR to RBG.
Now when we run the code shown above, we get the correct original
image shown below.
And this is how we can display OpenCV images in Python with matplotlib.
Related Resources
How to Randomly Select From or Shuffle a List in Python