
How to Plot a Graph with the Bokeh Module from Data from a CSV File using the Pandas Module in Python

In this article, we show how to plot a graph with the bokeh module from data from a CSV file using the pandas module in Python.
So the bokeh module in Python is a module that allows for the visualization of data, much like other modules do such as matplotlib and sympy.
You can feed data that the bokeh module can plot by creating the data directly in the program, or you can obtain the data from an external source, such as a CSV file. A module such as pandas can obtain the data from the CSV file and then we can use bokeh to plot the data. This is what we do in the program below.
So we're going to plot a very simple line in bokeh using data from a CSV file.
This CSV file is very basic containing x and y coordinates, 5 coordinate pairs in total that we'll plot.
If you want to use this exact CSV file, it can be found at the following link: line.csv
So you can download this CSV file and save it to your current working directory so that your Python program can read the data from it.
So the following code reads the data from the CSV file above and plots it using the bokeh module.
So the first thing we have to do is import the bokeh module.
We import figure from bokeh.plotting and we import output_file and show from bokeh.io
Next we creates a variable, df, which stores the contents of the CSV file, Line.csv, using the read_csv() function.
Within this data, we want to separate the x data and the y data.
So, we create a variable, x, and set it equal to, df["x"]. This represents all the x-coordinates.
We next create a variable, y, and set it equal to, df["y"]. This represents all the y-coordinates.
So we now have all of our x coordinates and our y coordinates.
We next save the contents of this graph in the output file, Linecsv.html
We next have to create our our line graph.
So we create a figure, named fig1.
We make this figure a line, passing in the x and y coordinates, by using the statement, fig1.line(x,y)
We then show the figure.
With the code above, we get the following contents shown below.
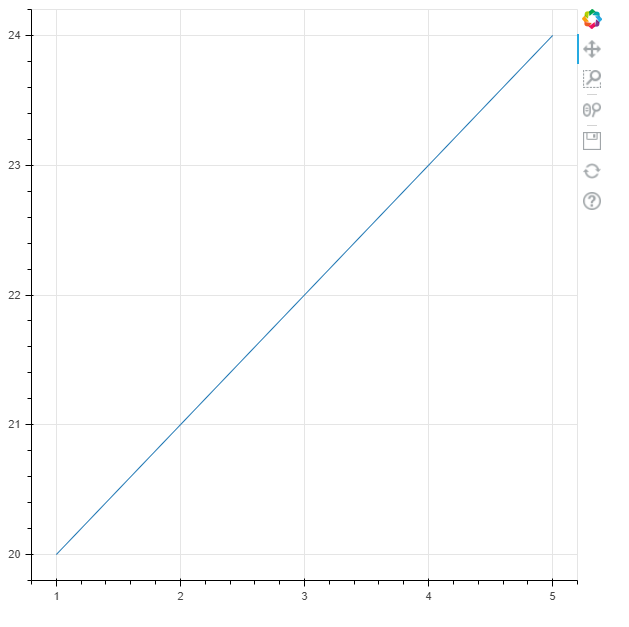
See in our line how all of the coordinates match up. The first point, going from left to right, is (1,10), followed by, (2,11), (3,12), (4,13), (5,14).
Also see the tools which the bokeh module supplies, including the ability to pan out, zoom in on the graph, save the graph,
and reset the graph back to its original position when it was first loaded.
And this is how to create a line graph in Python using the bokeh module.
Related Resources
How to Extract All Files and Folders from a Zip File in Python
How to Read the Contents of a Zip File in Python