
How to Plot a Graph with Matplotlib from Data from a CSV File using the Numpy Module in Python

In this article, we show how to plot a graph with matplotlib from data from a CSV file using the numpy module in Python.
Not always will you be providing data directly to a Python IDLE and creating a graph that way.
Many times, the data that you want to graph is found in some type of file, such as a CSV file (comma-separated values file).
Using the numpy module in Python, we can extract data from it, such as the x-axis data and the y-axis data.
We can then use matplotlib in order to plot the graph of the extracted data.
So what we have to do is create a CSV file. This can either be done with a high-level software such as Microsoft Excel or it can be done with a simple editor such as notepad. In this example, I actually create my CSV file with notepad. I save it with a .txt file extension.
I create a very basic CSV file, consisting of an x-axis that goes from 1 to 5.
These 5 data points have y-axis values.
This CSV file is shown at the following link: Example CSV File
Remember to place this CSV file in the folder that Python is running in. To see which folder this is, import the os module and type in, os.getcwd()
This will get the current directory that Python is operating in.
Place the CSV file in this directory, or change the directory to another one using the os.chdir() function.
So below, we read and extract data from this CSV file using the numpy module and then plot the data using matplotlib.
So the first thing we have to do is import matplotlib. We do this with the line, import matplotlib.pyplot as plt
We then have to import the the numpy module, since we use this module in order to extract data from the CSV file. This is done using the line, import numpy as np
We then have 2 variables which we separate with a comma and set equal to, np.loadtxt('csvfile1.txt', delimiter=',', unpack=True)
In the first parameter, we have 'csvfile1.txt'
This is the file that we are extracting data from.
In the second parameter, we specify the delimiter, which is set equal to a comma, ','
The delimiter can really be anything, but in our example we have the delimiter as a comma. If there are commas in the data, then you wouldn't specify a comma as the delimiter. Instead you would use some symbol as the delimiter that isn't found in the data.
In the third parameter, we have the statement, unpack=True
What this does is it unpacks the data by the delimiter into the x and y values.
Being that we have 2 columns, we have 2 variables. The x is the first column and the y is the second column.
We then have our x and y data, and we can plot the graph now with matplotlib.
The rest is just standard matplotlib code in which we plot the graph, add a title, and add x and y labels.
We then show the plot.
Once we run the code above, we get the following output shown below.
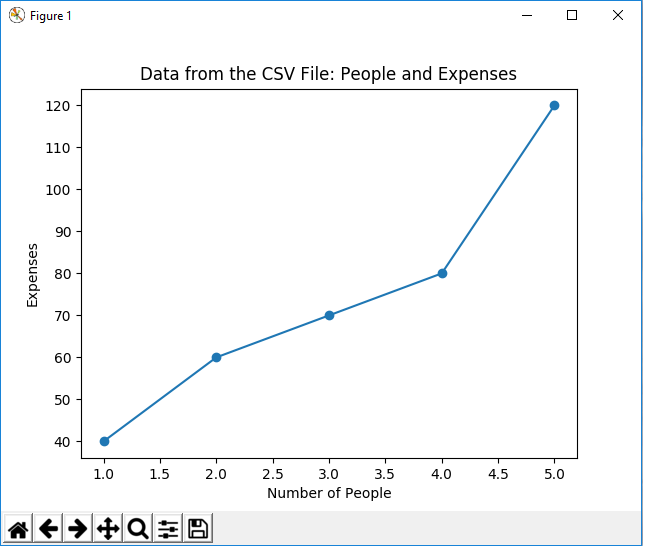
The numpy module makes it really easy to extract data from a text file, such as a CSV file. We then can subsequently graph the plot from the data extracted with numpy.
In this example, we plotted a line plot, but we really could do any time of graph.
And this is how to plot a graph with matplotlib from a CSV file using the CSV module in Python.
Related Resources
How to Randomly Select From or Shuffle a List in Python