
How to Plot a Line Graph in Python using the Bokeh Module

In this article, we show how to create a line graph, or plot a line, in Python using the bokeh module.
So the bokeh module in Python is a module that allows for the visualization of data, much like other modules do such as matplotlib and sympy.
The bokeh module can be used to plot different geometric functions, such as lines, triangles, and rectangles.
In this article, we start with a basic line.
In order to create this line, you will simply need the coordinates of points of the line.
The following code to create a line is shown below.
So the first thing we have to do is import the bokeh module.
We import figure from bokeh.plotting and we import output_file and show from bokeh.io
Next we list our x and y coordinates for the line.
So we create a list, x, which has 5 coordinates: 1,2,3,4,5
With each x-coordinates is a corresponding y-coordinates. This is a list as well, named y, which contains the 5 corresponding coordinates: 10,11,12,13,14.
Next, in the bokeh module, any time you want to show a graph, the file must be saved as something. If you don't specify anything, the bokeh module will create a default HTML file for you. If you want it named yourself, then you must specify a name in the output_file() function. This file will be saved in the current working directory.
Next, we have to create our line.
And the first step to creating a line is to create a figure. Everything is a figure in the bokeh module, including lines, triangles, rectangles, any type of shape.
So we create a figure, named fig1, and set it equal to figure(). This creates a figure.
To specifically create a line, we use the statement, fig1.line(x,y)
We then use the show() function to show the figure.
What really happens in the bokeh module is the module creates a file named, Line.html, as we specified, and then it opens up this file in whatever browser you specify and shows you the contents.
With the exact program above, we get the following contents shown below.
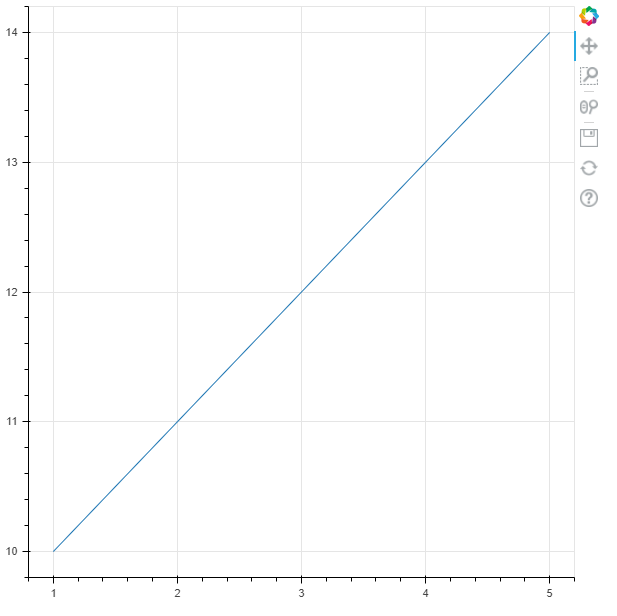
See in our line how all of the coordinates match up. The first point, going from left to right, is (1,10), followed by, (2,11), (3,12), (4,13), (5,14).
Also see the tools which the bokeh module supplies, including the ability to pan out, zoom in on the graph, save the graph,
and reset the graph back to its original position when it was first loaded.
And this is how to create a line graph in Python using the bokeh module.
Related Resources
How to Extract All Files and Folders from a Zip File in Python
How to Read the Contents of a Zip File in Python