
How to Print a Debug Statement through Serial Wire Viewing (SWV) in an STM32F4xx Microcontroller Board
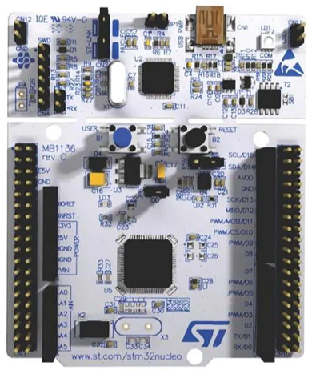
In this article, we show how to print a debug statement through the printf() function in an STM32F4xx microcontroller board through serial wire viewing (SWV).
The printf() function works over the SWO pin of the SWD (Serial Wire Debug) interface.
Using the serial wire output (SWO) pin is not possible for all STM32 microcontrollers, only for those whose boards have an Cortex M3 processor or above (meaning M3, M4, or higher). For Cortex-M0 processors, there is no ITM unit, so there is no SWO pin.
In Cortex-M3 processors and above, there is an ITM unit, which stands for Instrumentation Trace Macrocell Unit.
The ITM is an optional application-driven trace source that supports printf style debugging to trace operating system and application events, and generates diagnostic system information.
Serial Wire Debug (SWD) is a two-wire protocol for accessing the ARM debug interface; it also has 1 pin for trace applications. Serial Wire Debug is 2 pin (debug) + 1 pin (trace).
The Serial Wire Debug (SWD) is a part of the ARM Debug interface Specification v5 and is an alternative to JTAG. JTAG was the traditional mechanism for debug connections for ARM7/9 family but with the Cortex-M family, ARM introduced the Serial Wire Debug (SWD) interface. SWD is designed to reduce the pin count required for the debug from the 4 used by JTAG (excluding GND) down to 2. In addition, the SWD interface provides one more pin called SWO (Serial Wire Output) which is used for Single Wire Viewing (SWV) which is a low cost tracing technology.
The SWO pin is connected to the ST link circuitry of the board and can be captured using our debug software (IDE)
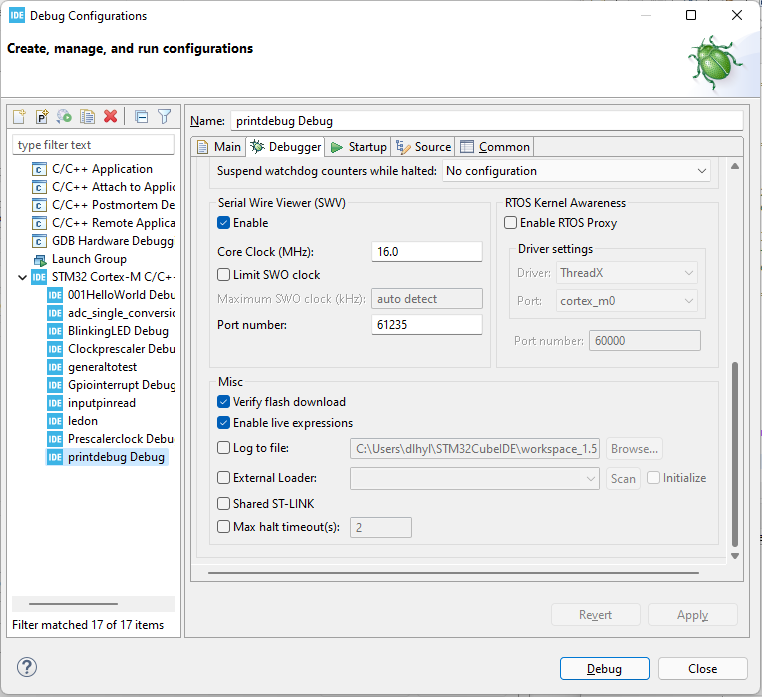
So in order to enable serial wire viewer (SWV), you must go to the debug settings and set it to enable.
This is shown below.
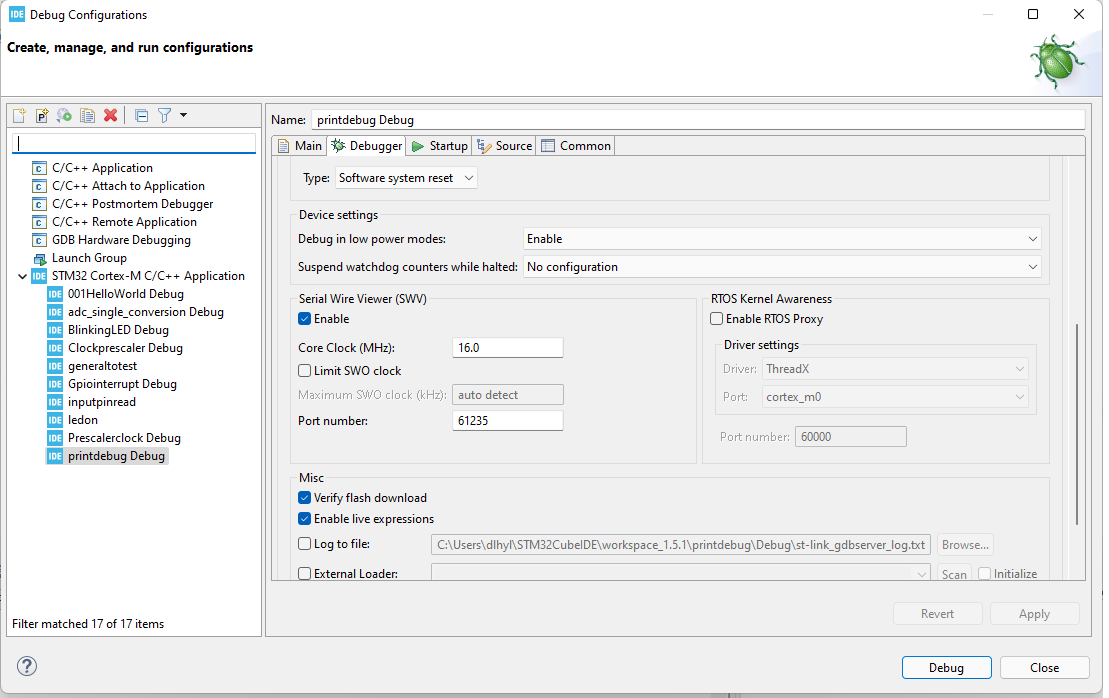
Without this enabled, you will not be able to use the printf() function in order to output data through the serial wire output pin. So this must be done.
In order to print data through the printf() function, which is
output through serial wire viewing, we have the following in our main.c file.
This code consists of a single printf() statement, in which you can print any text you want.
Now there is one more file that needs modification.
This is the syscalls.c file in the same directory as the main.c file.
You can place the following code within this file.
The idea of this code is that we can modify the printf() function by modifying the lower level write() function.
Within this write() function, we use the ITM_SendChar() function to write data to port 0 of ITM.
Now we can write Debug our code.
But you will not see the output yet without making some modifications.
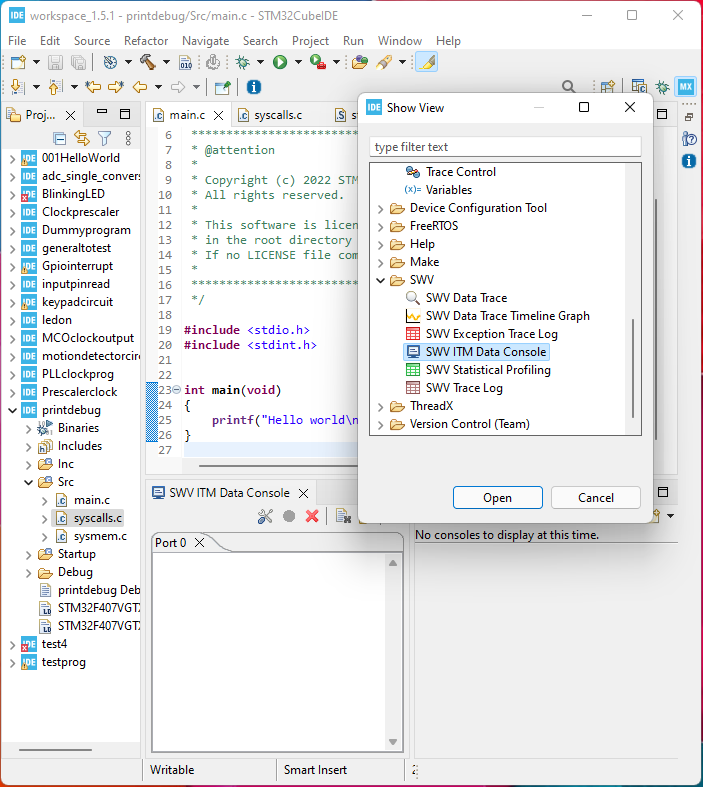
You need to go to Window tab and go to Show View.
Then you will select SWV ITM Data Console.
This is shown below.
Once you have this showing, you then can go to configure trace.
Remember that our code is designed to write data to port 0 of the ITM register.
Therefore, we must select port 0 of this register.
This is shown below.
Now you can start trace, which is shown below.
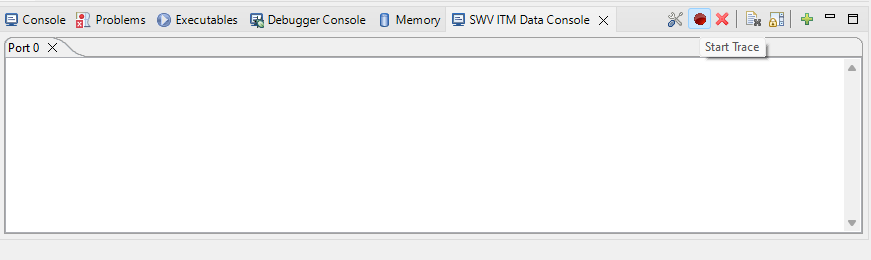
Now just resume the execution of the debug and you should see the print statement in the console.
This is shown below.
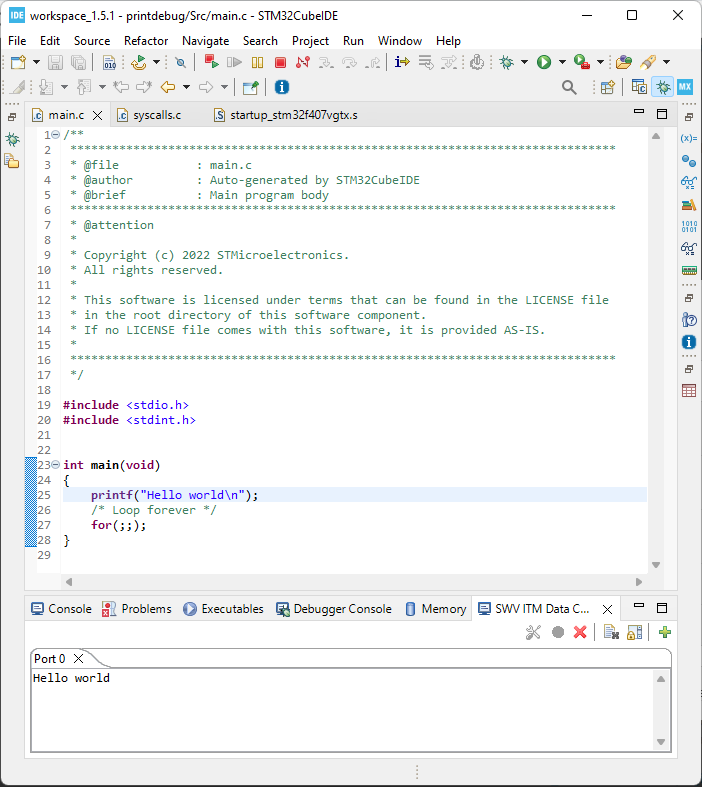
So you can see the output printed in the SWV ITM data console in Port 0.
So this is one way of printing a debug statement through serial wire viewing (SWV)
in an STM32F4xx board.
Related Resources