How to Set the X and Y Ticks on a Plot in Matplotlib with Python

In this article, we show how to set the x and y ticks on a plot in matplotlib with Python.
So we can set the range of what x values appear on the x-axis in matplotlib with the set_xlim() function.
We can set the range of what y values will appear on the y-axis in matplotlib with the set_ylim() function.
But how do we set where the ticks appear that mark values on the x and y axes?
We can do this in the matplotlib software in Python using the set_xticks() function to set where the ticks appear along the x-axis and we can use the set_yticks() function to set where the ticks appear along the y-axis.
So say we have an x-axis where the range is from 0 to 10.
And say we have a y-axis where the range is from 0 to 20.
We are going to write code so that the x-axis has a tick every 2 numbers (2,4, 6, 8, and 10) and the y-axis has a tick every n numbers (from 0 to 20).
Below is the code that does this.
So let's break down this code.
We first import matplotlib.pyplot as plt. This allows us to reference the plot as plt.
We creates an axes for the plot with the line, axes= plt.axes()
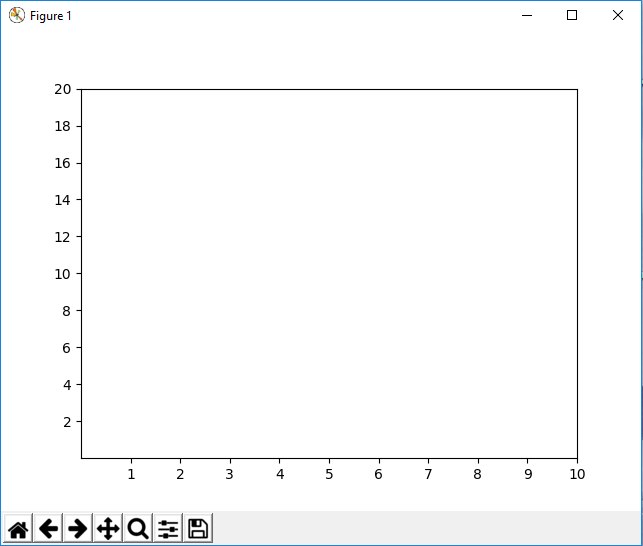
we then set the x-axis range using the axes.set_xlim() function. We specify 0 to 10 for the x-axis. On this x-axis, we want a tick to appear from 1 to 10. Therefore, we specify the line, axes.set_xticks([1,2,3,4,5,6,7,8,9,10]). This creates a tick at 1,2,3,4,5,6,7,8,9,10.
We then set the y-axis range using the axes.set_ylim() function. We specify 0 to 20 for the y-axis. On the y-ais, we want a tick to appear at each even number from 0 to 20, so this is 2,4,6,8,10,12,14,16,18,20. This creates a tick at 2,4,6,8,10,12,14,16,18,20.
We have now created custom ticks for the x-axis and the y-axis.
Running the following code above, we get the following output shown below.

So you can see that we have our custom ticks showing on the x- and y-axes.
With the range we specified for the x-axis, 0 to 10, by default (with me at least), the x-axis had ticks at every even number (2,4,6,8,10). However, with our custom tick specficiation, a tick appears at 1,2,3,4,5,6,7,8,9,10.
With the range we specified for the y-axis, 0 to 20, by default (again with me), the y-axis had ticks at every 2.5 numbers (2.5,5,7.5,10,12.5,15,17.5,20). With our custom tick specification, the y-axis has ticks at every 2 numbers (2,4,6,8,10,12,14,16,18,20).
Ant this is how to set x and y ticks on a plot in matplotlib with Python.
Related Resources
How to Randomly Select From or Shuffle a List in Python
