Variable Decelerations- Explained

Variable decelerations are a condition in which there is a reduced flow through the umbilical cord.
The reduced flow through the umbilical cord causes variable decelerations.
The umbilical cord connects the fetus to the placenta and contains three vessels, 2 arteries and 1 vein. The vein brings blood to the fetus to nourish the fetus and give oxygen. The 2 arteries carries blood away from the fetus and removes and transports waste products, such as carbon dioxide. Both serve the purpose in that fresh oxygenated blood is give to the fetus and waste products are taken away. So cord compression disrupts this process. The cord compression stimulates the vagal nerve in the fetus, which drops the blood pressure rapidly.
Unlike early and late decelerations, variable decelerations do not have a uniform shape; hence, this is why it's called variable. Each variable deceleration can be different, depending on the compression of the umbilical cord. The shape, duration, and degree of fall below baseline rate vary.
Variable decelerations fall and rise abruptly in a time period within 30 seconds with the onset and relief of cord compression. Early and late decelerations have gradual fall and rise times. With variable decelerations, the fall and rise are very steep and abrupt.
Variable decelerations also may occur at times unrelated to contractions. Early and late decelerations have some time schedule with contractions. However, variable accelerations may or may not be related to contractions.
In order to be characterized as a variable deceleration, the decrease in the fetal heart rate must be at least 15 beats per minute (bpm) lower than the baseline heart rate. This decrease must last at least 15 seconds but be less than 2 minutes.
Being that variable decelerations are quick drops and rises back to baseline, it may not be anything too serious. When it becomes serious is when the duration lasts for a long time. Then the baby is in a state of hypoxia and medical intervention is necessary. However, if it is simply for a few seconds and back to baseline, it is not a completely worrisome thing.
So now that you know what variable decelerations are and what causes them, let's see how to interpret them on a graph.
Below is a graph showing variable decelerations.
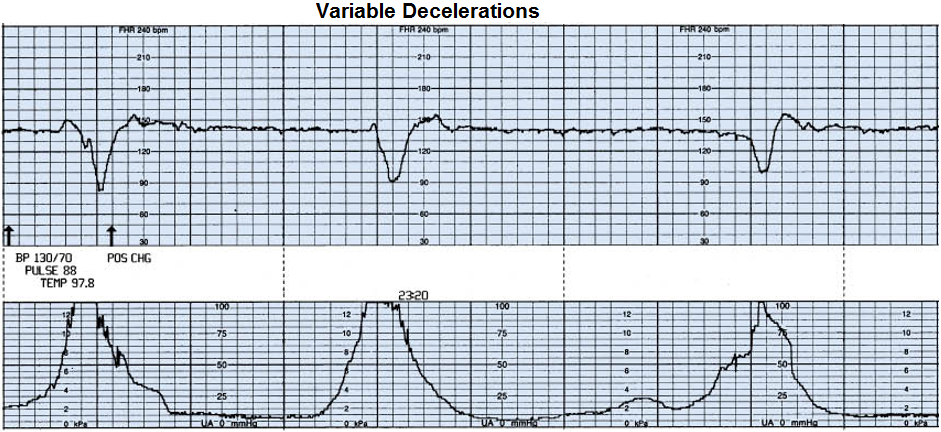
So here we have 2 graphs. The bottom graph represents and is measuring the mother's uterine contractions, which are contractions of the uterus. Remember the contractions are measured while a woman is in labor. These graphs are taken while a a woman is in labor. So she is having contractions at these times. The top graph represents the heart rate of the fetus. Therefore, we are able to monitor the fetal heart heart with the contractions, to see whether the contractions have any effect on the decelerations, whether they correlate.
The contractions are measured in mmHG, which you see at the bottom of the horizontal axis of the bottom graph. The heart rate, the top graph, is measured as the numerical beats per minute.
In this graph, the contractions do correlate with decelerations. As stated above, this is not always the case. But in this case, the contractions and variable decelerations are directly correlated. The likely reason for this is that the contractions places pressure on the umbilical cord. This reduces flow through the umbilical cord, causing the variable decelerations.
You can see how steep the decline and rise times are on the decelerations. Early and late decelerations have much gradual rise and fall times.
For this fetus, the baseline heart rate is about 140 beats per minute (bpm). So this is the baseline we're looking at. the first waveform, there is a brief acceleration up to 150bpm and then it goes back to baseline and then falls steeply down. Being that each box represents 10 seconds, it falls from baseline to the nadir (the lowest point of the heart rate), in about 15 seconds (1 and 1/2 boxes). It then takes the same 15 seconds to go from the nadir back to baseline. So the fall and rise takes about 30 seconds in total in the first variable deceleration. At the nadir, the heart rate is about 82 bpm. So the difference from baseline to nadir is 140bpm - 82 bpm, which is 58 bpm.
We now look at the second waveform. In terms of the variable deceleration taking place in regard to the contraction, it's the same thing. The greatest deceleration occurs at the peak of the contraction. Unlike the first contraction, this one lasts for a shorter period of time. The total rise and fall time is 20 seconds (2 boxes), with the fall taking 10 seconds (1 box) and the rise taking 10 seconds (1 box). The fall is not as steep as the first variable deceleration. It falls to a low of 90 bpm. So from the baseline, which is 140 bpm, it's a fall of 50 bpm.
And the third waveform is even shorter. The total time of rise and fall is 15 seconds, pretty much equally divided between the rise and fall. The nadir is not as low as the others, falling to 100bpm, for a total drop of 40 bpm.
So as you can clearly see, variable decelerations vary greatly. Each waveform can be completely different in regard to shape, duration, and nadir. It's all dependent on the amount of compression on the umbilical cord.
The important thing to monitor when you're a medical professional is the duration of the deceleration. If the deceleration is prolonged for a long period of time, then medical intervention is necessary. If the heart rate doesn't return back to baseline within 2 minutes, then intervention is definitely needed.
So this is variable decelerations in a nutshell.
Another graph showing variable decelerations is shown below.
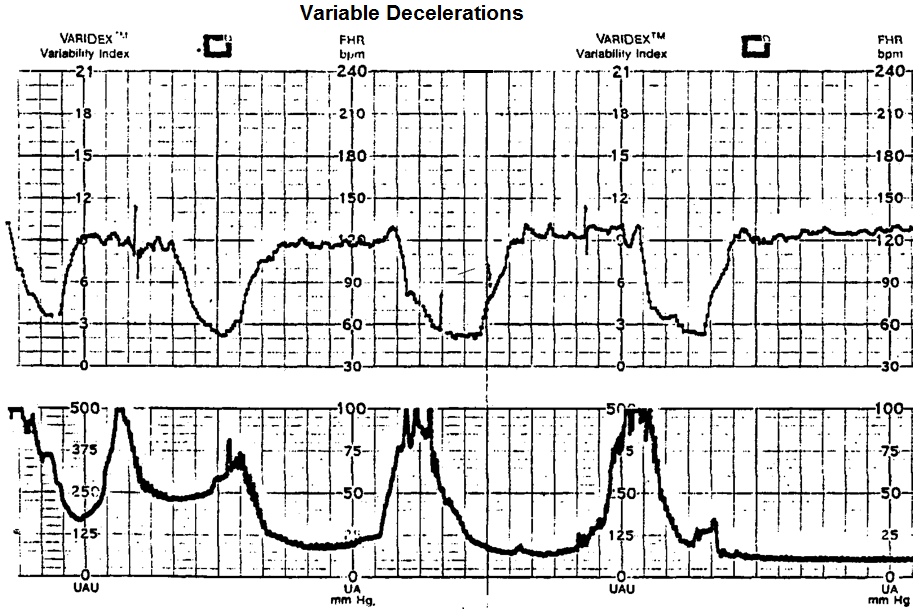
You can see that this one is a lot more variable in regards to the time that variable decelerations occur in regard to contractions.
In the first full contraction that you can see completely, there is no variable deceleration at all.
The first variable deceleration that you can see fully begins well before the peak of the next contraction.
The next variable deceleration occurs pretty much in line with the peak of the contraction.
And the last variable deceleration occurs after the peak of the contraction.
So you can see how variable decelerations is a complete mix. It can be early decelerations, it can be late decelerations, or it can be neither. It's just mixed and variable and jumbled all together.
So this demonstrates very well the variability that you can see in variable decelerations.