Capacitor Charging Graph
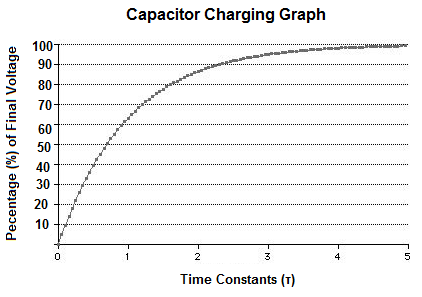
The Capacitor Charging Graph is the a graph that shows how many time constants a voltage must be applied to a capacitor before the capacitor reaches a given percentage of the applied voltage.
A capacitor charging graph really shows to what voltage a capacitor will charge to after a given amount of time has elapsed.
Capacitors take a certain amount of time to charge. Charging a capacitor is not instantaneous. Therefore, calculations are taken in order to know when a capacitor will reach a certain voltage after a certain amount of time has elapsed.
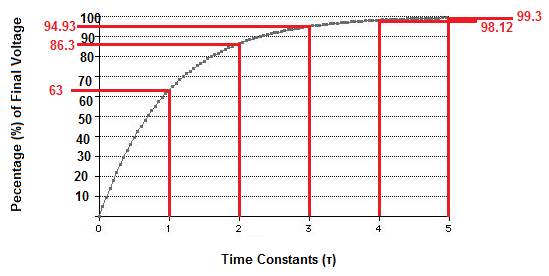
The time it takes for a capacitor to charge to 63% of the voltage that is charging it is equal to one time constant. After 2 time constants, the capacitor charges to 86.3% of the supply voltage. After 3 time constants, the capacitor charges to 94.93% of the supply voltage. After 4 time constants, a capacitor charges to 98.12% of the supply voltage. After 5 time constants, the capacitor charges to 99.3% of the supply voltage.
The graph below shows all these transitions of capacitor charging time: