
How to Plot a Function in Python using the Sympy Module

In this article, we show how to plot a function in Python using the sympy module.
There are various modules that can be used to plot functions in Python.
The sympy module is one of the modules that allows us to plot mathematical functions.
Below we will plot the function, 2x+1, using the sympy module. This is shown in the code below.
So the first thing we must do is import the plot function from the sympy module.
We must also import Symbol from sympy, because the program needs to know that x is the variable in the function we are going to plot.
We then use the plot() function to plot the function. The only parameter that needs to be passed into the plot function is the function to be plotted.
The result of this program is shown below.

So once we use the sympy plot() function in Python, it plots a function on an x-y coordinate graph.
Notice how the x-coordinates range from -10 to 10 by default. Notice how the graph has no title. Notice how the x-axis is labeled 'x' and the y-axis is labeled 'f(x)'. We can change all these default values into our own custom values. We change the x-coordinates from -20 to 20. We change the title to 'Graph of 2x+1'. We keep the x-axis label as 'x'. We change the y-axis label to '2x+1'. These custom values are all added to the plot() function.
This is shown in the code below.
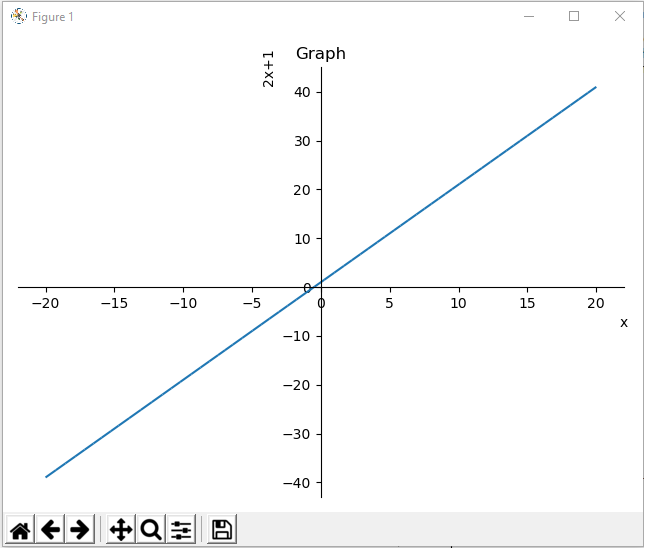
Now we've customized the graph a bit.
Instead of the x-coordinates ranging from -10 to 10, they now range from -20 to 20.
Instead of having no title, we now have the title of 'Graph'.
We then set the x and y axes labels.
This produces the following image shown below.
If you don't want to show the graph right away but instead want to save it, you can use the following
code below.
The parameters, show=False, will not show the function right away, as it may not always be required. Sometimes
we may want to save the function in our existing files to show it later.
And this is how to plot a function in Python using the Sympy module.
Related Resources
How to Plot Multiple Function in Python using the Sympy Module