How to Plot Multiple Functions on a Single Graph in Python using the Sympy Module

In this article, we show how to plot multiple functions on a single graph in Python using the sympy module.
There are various modules that can be used to plot functions in Python.
The sympy module is one of the modules that allows us to plot mathematical functions.
We've shown in a previous article,
How to Plot a Function in Python using the Sympy Module, to show how to plot a single function on a graph in Python.
Now in this article, we show how to plot multiple functions on a graph in Python using the sympy module.
So the first thing we must do is import the plot function from the sympy module.
We must also import Symbol from sympy, because the program needs to know that x is the variable in the functions we are going to plot.
We then use the plot() function to plot the functions. The only parameter that needs to be passed into the plot function are the functions to be plotted.
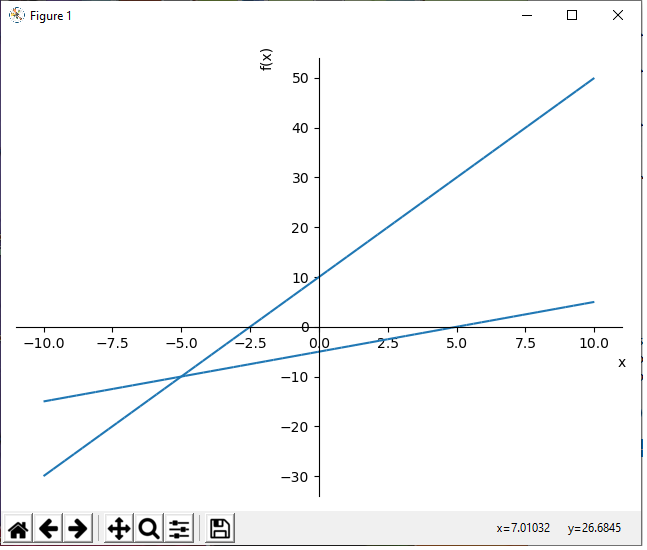
The result of this program is shown below.

So once we use the sympy plot() function in Python, it plots the functions on an x-y coordinate graph.
Notice how the x-coordinates range from -10 to 10 by default. Notice how the graph has no title. Notice how the x-axis is labeled 'x' and the y-axis is labeled 'f(x)'. We can change all these default values into our own custom values. We change the x-coordinates from -20 to 20. We change the title to 'Graph'. We keep the x-axis label as 'x'. We keep the y-axis label as 'f(x)'. These custom values are all added to the plot() function.
This is shown in the code below.
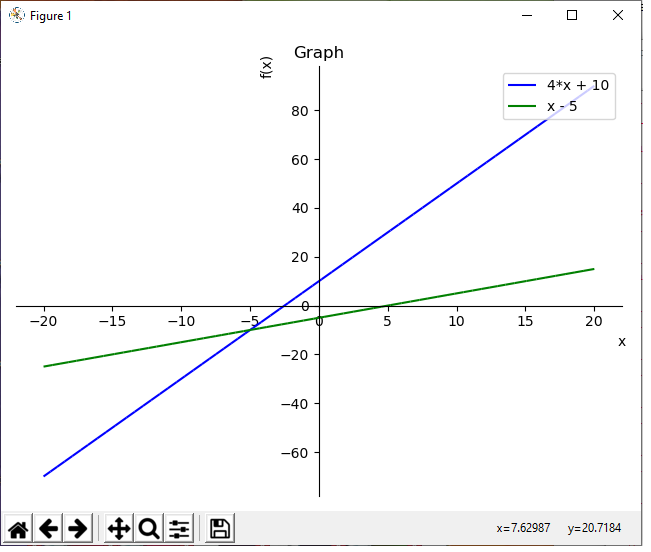
Now we've customized the graph a bit.
Instead of the x-coordinates ranging from -10 to 10, they now range from -20 to 20.
Instead of having no title, we now have the title of 'Graph'.
We then set the x and y axes labels.
Usually with multiple functions on a graph, it's preferable to have legends so that it's easily known which function is which on a graph. Therefore, we add, legend=True, to the plot() function in order to be able to differentiate the functions from one another.
Initially, we do not want to show this graph, because we haven't yet customized the colors of each function. If you were to show the graph right away, there would be no difference in color between the functions in the legend. Therefore, the legend isn't useful, because there's no differentiating factor between the functions. In sympy, with a legend, you must specify the color coding, so that different functions are differentiated. 'b' stands for blue. 'r' stands for red. 'g' stands for green. 'y' stands for yellow. These are colors you can use to differentiate functions on a graph.
The first function has an index of 0. In this example, we assign this function the color of blue.
The second function has an index of 1. In this example, we assign this function the color of green.
We then show the graph.
This produces the following image shown below.

If you don't want to show the graph right away but instead want to save it, you can use the following
code below.
So this graph will now be saved as 'Multiple-functions.png' in the current working directory.
And this is how to plot multiple functions in Python using the Sympy module.
Related Resources
How to Extract All Files and Folders from a Zip File in Python
How to Read the Contents of a Zip File in Python
