
Z Score Calculator
Converting a Raw Score to a Z Score
This z score calculator calculates the z score based on the given raw score, the mean, and the standard deviation.
The z score is a numerical value which represents how many standard deviations a score is above the mean.
The z score, thus, tells us how far above or below average a score is from the mean by telling us how many standard deviations it lies above or below the mean.
If you want to compute the raw score, based on the z score, mean, and standard deviation, see Z Score to Raw Score Calculator.
So, for example, if we obtain a z score of 1, then the score obtained is 1 standard deviation above the mean. If the z score is -1, then the score is 1 standard deviation below the mean. If the z score obtained is 2, then the score obtained is 2 standard deviations above the mean. If the z score is 3, then the raw score obtained is 3 standard deviations above the mean.
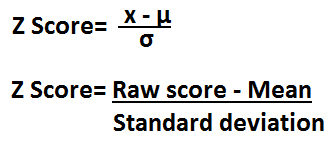
To make this example even clearer, let's take a set of numbers to illustrate the z score. Let's say for the SAT, the average MATH score is 500 and the standard deviation for the test for all students who took it is 100. This means that most people scored between a 400 and a 600 on the MATH portion of the SAT. Being that the mean is again 500, if a person obtains a raw score of 600, this is exactly 1 standard deviation above the mean. Thus, the z score will be 1. The math to show this is to take the formula above, z-score= (x - µ)/σ and plug in the values, so z-score= (600-500)/100=1. The z score shows that 600 is exactly one standard deviation above the mean of 500. Now if a person scores a 750 on the MATH portion, the z score will now be z-score= (750-500)/100= 2.5. This means now that the person scored 2.5 standard deviations above the mean. Since most people score within 2 standard deviations of a mean, a standard deviation of 2.5 (for a test) is an exceptional number above average, while a standard deviation of -2.5 would be a very poor score. According to Chebyshev's Rule, which summarizes standard deviations, at least 75% of all of a population will score within 2 standard deviations of the mean. At least 89% of a population will score within 3 standard deviations of a mean. And at least 93.75% of a population will score within 4 standard deviations of a mean. This gives more meaning to the z score obtained because you can see how extraordinary it would be to have very high or low z scores. Being that at least 93% of the population will score within 4 standard deviations, obtaining a z score of, say, 8, would be extremely rare and show a rare sight. This is how mathematicians gauge this score.
To use this calculator, a user just enters the raw score obtained, the mean (or average) of the scores, and the standard deviation, and then clicks the 'Calculate' button. The result will automatically be calculated and shown.
Z scores can be used for all types of data sets, including for electronics. Z scores are used to show how much variance a piece of data is from its mean. For example, let's say a wire
carries a normal, or mean, current of 20mA. And then all of a sudden, there is a surge and it now carries 200mA. We can use the z score to gain statistical data on electronics in this way to show
how many standard deviations this is from the norm. This way, we have another way of quantifying and interpreting this data.
Example Calculations
Find the z score for a housing price when the house's raw value is $310,000, the average mean for houses in the area is $280,000, and the standard deviation is $12,000.
Answer:
z-score= (x - µ)/σ
z-score= (310,000-280,000)/12,000= 2.5
So the z score is 2.5, meaning that the price of the house is 2.5 standard deviations above the mean.
Find the z score for an exam when the raw score obtained is 95, the average mean for the test is 70, and the standard deviation is 15.
Answer:
z-score= (x - µ)/σ
z-score= (95-70)/15= 1.67
So the z score is 1.67, meaning it is 1.67 standard deviations above the mean.
Related Resources
Expected Value Calculator
Area Under the Curve Calculator
Confidence Interval Calculator