
Area Under the Curve Calculator
Area Under the Curve based on the Standard Normal Distribution Curve (Z score)
This Area Under the Curve Calculator calculates the area under the curve based on the z-score entered.
The z score is a numerical value which represents how many standard deviations a score is above or below the mean.
The z score, thus, tells us how far above or below average a score is from the mean by telling us how many standard deviations it lies above or below the mean.
So, for example, if we have a z score of 1, then the score obtained is 1 standard deviation above the mean. If the z score is -1, then the score is 1 standard deviation below the mean. If the z score obtained is 2, then the score obtained is 2 standard deviations above the mean. If the z score is 3, then the raw score obtained is 3 standard deviations above the mean.
So, again based on the z score, we can determine how many standard deviations we are from the mean. Statistically speaking, once we know how many standard deviations we are from the mean, we can determine what percentage of a sample set falls into this bracket, as long as the distribution is normally distributed. In standard normal distribution, a certain percentage will lie within given values of z scores (or standard deviations). If the z score is 1, approximately .8413 or 84.13% of the sample set will fall within this z score value. If the z score is 2, approximately .9772 or 97.72% of the sample set will fall in this range. If the z score is 3, approximately .9987 or 99.87% will fall within this range. These values will be the same for any sample set or population, as long as it follows the standard normal distribution curve. If it is normally distributed, these percentage values will always be the same for their respective z score values. These percentage or decimal values are equivalent to the area under the curve. So, again, for example, if the z score is 1, .8413 of the population or sample set will be the value under the curve.
The total possible value that can be under the curve is 1.00. This means that if the whole population fell under the curve, the area would be a value of 1.00.
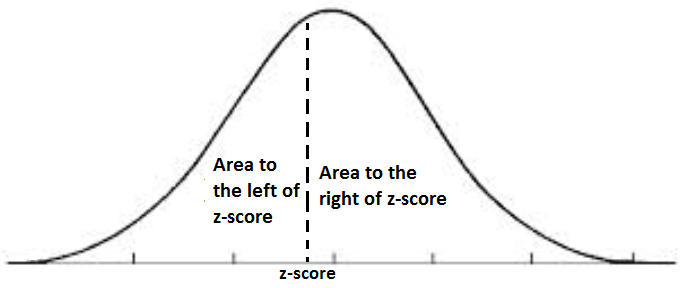
The area to the left of the z score represents the total area under the curve that is left to the z score. Similarly, the area to the right of the z score represents the total area under the curve that is right of the z score. The area to the left really represents how much (in percentage or decimal value) of the population falls within this z score value. The area to the right represents how much of the remaining population did not fall within this z score value. So, for example, with a z score of 1, .8413 of the population falls within this z score range. 0.8413 is the area to the left. The area to the right, .1597 is the area to the right. This represents the population that does not fall within this z score range. Since the total area under the curve is 1, whatever the area to the left is, the area to the right is 1 - area to the left.
This calculator calculalates the area based on a z score from -4 to +4. The z score entered must be between -4 and 4. Any z score less than -4 and greater than 4 is outside the domain and the calculator will throw an error.
Calculating the area under the curve can be useful for any statistical purposes for any science, including electronics.
Area Under Curve Between Z Scores
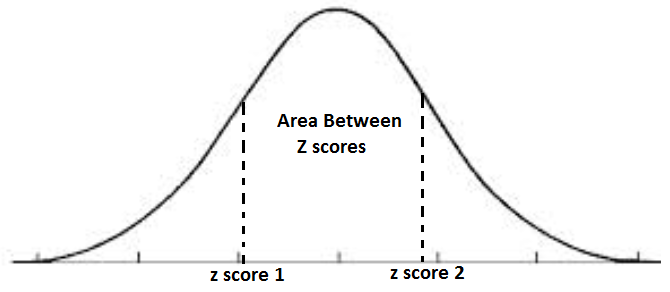
The Area Under the Curve Between Z scores calculates the area under the curve between the 2 z-scores entered in.
To use this calculator, a user simply enters in the first z-score and then the second z-score and clicks the 'Calculate' button. The calculator will then automatically calculate the area between the 2 z scores, according to the formula z2-z1. It does this by looking up the area to the left of the first z score and then looking up the area to the left of the second z score. If you take the value of the area of the first z score and subtract it from the area of the second z score, this difference represents the area under the curve between these 2 z-score values.
Just like the above calculator, the z scores entered must be numeric values between -4 and +4. Any z scores outside these values will be outside the range and throw an error.
Calculating the area under the curve between z scores can be useful for any statistical purposes for any science, including electronics.
Related Resources
Variance Calculator
Standard Deviation Calculator
Expected Value Calculator
Z Score Calculator
Z Score to Raw Score Calculator
Chebyshev's Theorem Calculator
Binomial Coefficient Calculator
Bernoulli Trial Calculator
Confidence Interval Calculator
Hypothesis Testing Calculator