
Standard Deviation Calculator

Population Standard Deviation
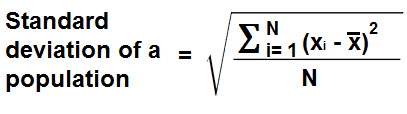
This Population Standard Deviation Calculator calculates the standard deviation of a population.
A population represents the entire set of data. This includes each person, item, etc. For example, if we are talking about a class of 30 students, the population would be all 30 students. This is in contrast to a sample (discussed below), which represents a portion of the population. For example, a sample may take 10 students and examine their data, and draw a conclusion from these 10 students to make a conclusion about how the whole class will do.
A standard deviation is a statistical measure which shows how much variation or dispersion there is in a set of data from its mean.
A low standard deviation means there is not much variation between the individual data values from the mean of the whole set. In other words, the data points tend to be very close to the mean. An example of a set of data with low standard deviation is 2.21, 2.22, 2.23, 2.24, 2.25. For this set of data, the mean is 2.23. All the data values are very close to this value.
A high standard deviation means there is the data points tend to be spread out over a large range of values; in other words, the individual data points tend to be far from the mean. Therefore, the values are very spread out. For example, the data 0, 100 have a mean of 50. However, the individual data points, are very far from the mean of 50. This data set has a very high standard deviation being that the values are so spread out from the mean.
Standard deviation is an important and highly used measure because it shows how spread out data is from its mean. When we calculate standard deviation, we know how far scores tend to lie within a mean. Therefore, we can get a rough estimate of how close values are from within one standard deviation. Say, for example, the mean on a test is 80 and the standard deviation is 5. This means the majority of the scores are between 75 and 85, since most values in a data set are within one standard deviation of the mean. And if we were to go out to 2 standard deviations, almost all students would have scored between this value. According to Chebyshev's Rule, which summarizes standard deviations, at least 75% of all of a population will score within 2 standard deviations of the mean. At least 89% of a population will score within 3 standard deviations of a mean. And at least 93.75% of a population will score within 4 standard deviations of a mean. Thus, standard deviation, statistically, tells us a lot.
To use this calculator, a user just enters in the set of numbers which he wants to compute the standard deviation for, with each number separated by a comma. A comma must be used to separate the values, or else the calculator will not work. Any other delimiter, including a space between numbers, will cause the calculator not to work. Only commas to separate values are recognized. After the set of numbers are entered in, the user clicks the 'Calculate' button, and the resultant standard deviation value will be calculated and displayed.
The units which the standard deviation calculator solves for is the same as the units which are entered into the input field. For example, if the values entered into the input field are in unit inches, the resultant standard deviation value will be in unit inches. The unit does not change from input to resultant value.
Calculating the standard deviation is important for many various statistical purposes and provides another way to quantify our results. For electronics, we may have a average
current, voltage, etc value. With standard deviation calculated, we can determine how many standard deviations a given current, voltage, etc is above its norm. This could be useful for
various possible statistical purposes.
Sample Standard Deviation
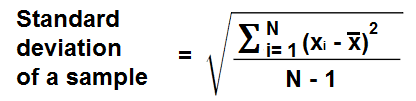
The Sample Standard Deviation Calculator computes the standard deviation for a sample of a population.
A sample of a population represents a portion of the population chosen for statistical purposes rather than the whole entire population, which is the calculator above.
The standard deviation of a population is calculated differently than an entire population. Instead of dividing by the entire number of the sample, which we normally represent as N to represent the full number of units, we divide by N-1. This will always ensure that the standard deviation for a sample will always be somewhat higher than the standard deviation for the population.
Dividing by N-1 may seem like a strange convention, but since a sample does not represent the full population, mathematicians divide by N-1 to account for the fact that the full population isn't used, and so that the sample will be somewhat higher (it bumps up the value a little).
To use this calculator, just like the last, simply enter in the list of numbers for which you want to find the standard deviation of, and then click the 'Calculate' button. The
standard deviation of the numbers will be automatically computed and shown.
Example Calculations
Calculate the standard deviations of the numbers 3, 5, 7, 9, 11, and 17.
Answer:
Standard Deviation of population: 4.5338235029118
Standard Deviation of sample: 4.9665548085838: 7
Calculate the standard deviation of 1.2, 3.5, 6.8. 9.7
Answer: Related Resources
Confidence Interval Calculator
Standard Deviation of population: 2.2983085567918
Standard Deviation of sample: 2.8148416178061
Dot Product Calculator
FOIL Calculator- Multiplying Binomials
Exponential Calculator
How to Convert Degrees to Radians
How to Convert Radians to Degrees
Degrees to Radians Calculator
Radians to Degrees Calculator
Ratio Calculator
Expected Value Calculator