
Slope and y-intercept of a Regression Line (Best Fit Line) Calculator
Data Points
This Slope and y-intercept Calculator calculates the best-fitting slope and best-fitting y-intercept for a linear line based on the given data points supplied.
So we begin with a few data points.
We create a regression line to build the best-fitting line for the various data points.
A regression line is a line that tries its best to represent all of the data points as accurately as possible with a straight line. It strives to be the best fit line that represents the various data points.
A regression line can be calculated based off of the sample correlation coefficient, which is a measure of the strength and direction of the linear relationship between 2 quantitative variables. If data points are perfectly linear, the sample correlation will either be 1 (for a line with a positive slope) or -1 (for a line with a negative slope). All values in between are not linear (with the exception of a vertical line which has a correlation coefficient of 0).
So based off of the sample correlation coefficient, we can determine the calculate the slope and y-intercept of the best-fitting line for these data points.
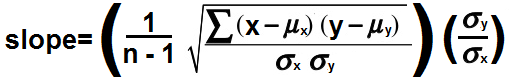
How we determine the slope of the line is complex for a regression line and is not simply rise/run, as the simple formula is. To find the slope of a regression line (or best-fitting line), the formula is, slope, m= ((1/n-1)∑(x-μx) (y-μy)/σxσy)(σy/σx) Or if we take simplify by putting in r for the sample correlation coefficient, the formula is, slope, m= r(σy/σx)
So once you have computed the correlation coefficient, then calculating the best fit line is relatively simple.
We first calculate the slope through the formula, m= r(σy/σx)
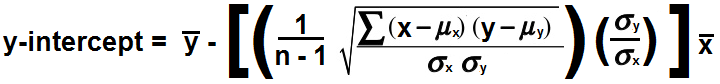
Once we have done this, then we can calculate the y-intercept. We do this by multiplying the
slope by
With the slope and y-intercept calculated, we then can have our regression line.
Example
Now that you know the steps to do, let's actually do an example.
So as an example, let's say we have a correlation coefficient of 0.98,
So to find the slope, we use the formula, m= r(σy/σx)= 0.98(5/4.58)= 1.069
We then need to find the y-intercept. We multiply the slope by
We then subtract this value from
So our final regression line is, y= 1.069x + 4.511
To use this calculator, a user simply
enters in the x and y value pairs. A user can enter anywhere from 3 to 10 (x,y) value pairs.
After, the user clicks the 'Calculate' and the expected value will be calculated and automatically displayed.
Related Resources
Hypothesis Testing Calculator
Variance Calculator
Standard Deviation Calculator
Expected Value Calculator
Z Score Calculator
Z Score to Raw Score Calculator
Chebyshev's Theorem Calculator
Binomial Coefficient Calculator
Bernoulli Trial Calculator
Area Under the Curve Calculator
Confidence Interval Calculator
R Squared Calculator (Coefficient of Determination)