
R-Squared Calculator (Coefficient of Determination)
This R-Squared Calculator is a measure of how close the data points of a data set are to the fitted regression line created.
R2 is also referred to as the coefficient of determination.
In essence, R-squared shows how good of a fit a regression line is.
The closer R is a value of 1, the better the fit the regression line is for a given data set.
R-squared values are used to determine which regression line is the best fit for a given data set.
For example, say that you created 3 regression lines for a data set based on a variety of different methods. You can then find the R-squared value for each of these regression line plots. The value of R-squared that is closest to one is likely the best fit for the data set and probably be the regression line to use for data. So, say, we create 3 regression lines and the r-squared values for each of them are 0.6, 0.85, and 0.92, the regression line with an r-squared value of 0.92 is the best-fitting regression line for the data points. And this regression most likely should be used.
As you may be aware, regression lines are used a lot in machine learning. Based on the available obtained data, regression lines are obtained and these regression lines can be used to predict future values based on the previous past data.
Thus, calculating the r-squared values for regression lines is essential for choosing the best-fitting regression line and, thus, can have the best machine-learning application.
r-squared is really the correlation coefficient squared.
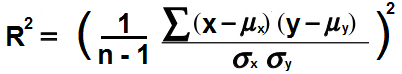
The formula for r-squared is, (1/(n-1)∑(x-μx) (y-μy)/σxσy)2
So in order to solve for the r-squared value, we need to calculate the mean and standard deviation of the x values and the y values.
We're now going to go through all the steps for solving for the r square value.
So the first thing is we need to
calculate the mean for the x values and the y values.
The mean for the x values may be represented either by
μx or
After this, we have to calculate the standard deviations for the x and y values. The standard deviation for the x values is represented by σx and the standard deviation for the y values is represented by σy. The standard deviation for the x values is taken by subtracting the mean from each of the x values, squaring that result, adding up all the squares, dividing that number by the n-1 (where n is the number of items), and then taking the square root of that result. The same for y values.
After this, for each (x,y) pair in the data set, we take each x value and minus
We then divide this sum by the product of the standard deviations, σx and σy.
We divide the result by n-1, where n is the number of paired (x,y) data points.
At to this point, we have solved for r, or the correlation coefficient value.
The only final step is to square this r value to get the
r-squared value. So, lastly, we square this number to get
the r2 value.
Example
Now that we've gone through the steps for solving for r2, let's actually do an example.
So as an example, let's take the data points (2,7), (8,12), (11,17)
The standard deviation for the x values, σx, is 4.58. The standard deviation for the y values, σy, is 5.
We then take each of the x values and minus
Adding up each of these gives us, (25+20)=45
The product of the standard deviations for x and y (σy * σy), gives us, (4.58*5)=22.9
45/22.9 = 1.965
We then divide this number by n-1. So, (1.965/2)= 0.98
Lastly, we square 0.98 to get the r2 value. 0.982= 0.96
To use this calculator, a user simply
enters in the x and y value pairs. A user can enter anywhere
from 3 to 10 (x,y) value pairs.
After, the user clicks the 'Calculate' and the expected value
will be calculated and automatically displayed.
Related Resources
Hypothesis Testing Calculator
Variance Calculator
Standard Deviation Calculator
Expected Value Calculator
Z Score Calculator
Z Score to Raw Score Calculator
Chebyshev's Theorem Calculator
Binomial Coefficient Calculator
Bernoulli Trial Calculator
Area Under the Curve Calculator
Confidence Interval Calculator
Sample Size Calculator
Margin of Error Calculator
Regression Line Calculator
Slope and y-intercept of a Regression Line Calculator