
Sample Correlation Coefficient Calculator
This Sample Correlation Coefficient Calculator calculates the sample correlation between 2 variables.
Sample correlation is a measure of the strength and direction of the linear relationship between 2 quantitative variables.
The classic situation of the 2 quantitative variables are (x,y) pairs.
The sample correlation measures the extent relationship between each of the x and y values for the given (x,y) pairs.
If a line is perfectly linear either horizontally or has a perfect linear positive slope, then the sample correlation will be 1. 1 represents perfect linearity.
If a line is perfectly vertical, going straight up and linear, then the sample correlation will be 0.
If a line is perfectly linear and has a negative slope, then the sample correlation will be -1.
So these just serve as reference points for sample correlation variables.
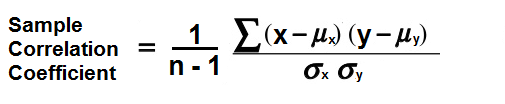
So let's now get into the formula for sample correlation. So the formula to calculate the sample correlation coefficient is as follows: sample correlation coefficient= (1/n-1)∑(x-μx) (y-μy)/σxσy
So in order to solve for the sample correlation coefficient, we need to calculate the mean and standard deviation of the x values and the y values.
We're now going to go through all the steps for solving for the sample correlation coefficient.
So the first thing is we need to calculate the mean for the x values and the y values. The mean for the x values may be represented either by
μx or
After this, we have to calculate the standard deviations for the x and y values. The standard deviation for the x values is represented by σx and the standard deviation for the y values is represented by σy. The standard deviation for the x values is taken by subtracting the mean from each of the x values, squaring that result, adding up all the squares, dividing that number by the n-1 (where n is the number of items), and then taking the square root of that result. The same for y values.
After this, for each (x,y) pair in the data set, we take each x value and minus
We then divide this sum by the product of the standard deviations, σx and σy.
Lastly, we divide the result by n-1, where n is the number of paired (x,y) data points.
Example
Now that you know the steps to do, let's actually do an example.
So as an example, let's take the data points (2,7), (8,12), (11,17)
The standard deviation for the x values, σx, is 4.58. The standard deviation for the y values, σy, is 5.
We then take each of the x values and minus
Adding up each of these gives us, (25+20)=45
The product of the standard deviations for x and y (σy * σy), gives us, (4.58*5)=22.9
45/22.9 = 1.965
Lastly, we divide this number by n-1. So, (1.965/2)= 0.98
To use this calculator, a user simply
enters in the x and y value pairs. A user can enter anywhere from 3 to 10 (x,y) value pairs.
After, the user clicks the 'Calculate' and the expected value will be calculated and automatically displayed.
Related Resources
Hypothesis Testing Calculator
Variance Calculator
Standard Deviation Calculator
Expected Value Calculator
Z Score Calculator
Z Score to Raw Score Calculator
Chebyshev's Theorem Calculator
Binomial Coefficient Calculator
Bernoulli Trial Calculator
Area Under the Curve Calculator
Confidence Interval Calculator
Sample Size Calculator
Margin of Error Calculator
T-value Calculator
Regression Line Calculator
Slope and y-intercept of a Regression Line Calculator
R Squared Calculator (Coefficient of Determination)