
Test Statistic Calculator
Test Statistic for One Population Mean Calculator
The Test Statistic for One Population Mean Calculator is a calculator that is used when the variable is numerical and only one population or group is being studied.
Let's say that an economist, Economist William German, believes that students who work and go to college only spend, on average, $15 a day on food. The variable, money, is numerical and the population is all students who work and go to college.
The null hypothesis in this example for this economist is, H0= μ= $15. μ represents the average money in dollars amount that all working college students spend a day on food. The economist is claiming that this average amount is equal to $15.
The alternative hypothesis, Ha, is either μ > 15, μ < 15, or μ ≠ 15. In this example, we'll say that Ha is equal to $20 a day. So the alternative hypothesis is that working college students actually spend $20 a day on food instead of the $15 that the economist believes they spend.
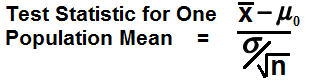
So going back to this example, we use the formula for
the test statistic for one population mean, which is, Z= (
So in this example, the mean,
Test Statistic Comparing Two Means Calculator
This Test Statistic Comparing Two Population Means Calculator calculates the test statistic when comparing two population means.
This test is used when the varaible is numerical (for example, cost of goods, earnings, stock price) and two populations or groups are being compared.
Two separate random samples must be selected, one from each population, in order to calculate the resultant test statistic.
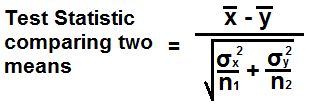
The formula to calculate the test statistic comparing two population means is, Z= (
In order to calculate the statistic, we must calculate the sample means (
We then proceed by finding the difference between the sample means (
We then compute √(σx2/n1 + σy2/n2), which is the standard error.
We then divide the difference of the means by this standard error.
Let's go over a practice. Let's say we have a random sample of 40 cars from each company in which we are comparing two companies. These are electric cars and we want to measure how far each car can go once fully charged. Suppose the average miles the tesla can go is 200 miles with a standard deviation of 1.2 and the average miles the nissan leaf can go is 190 miles with a standard deviation of 1.5.
Given this data,
We now have all our data to compute the test statistic comparing two population means. Plugging these into our formula gives us,
Z= (
Test Statistic for a Single Population Proportion Calculator
The Test Statistic for a Single Population Proportion calculates the test statistic when the variable is categorial (for example, gender, workers/unemployed, democrats/republicans) and only one population is being studied.
The test is looking at the proportion of individuals in the population who have a certain characteristic- for example the proportion of females who have kids.
The null hypothesis is H0:p=p0, where p0 is a certain claimed value.
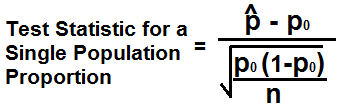
The formula for the test statistic for a single proportion is, Z= (ṗ - p0)/√p0(1-p0)/n
ṗ represents the number of people in the same population who have a particular characteristic of interest (for example, the number of women who are currently pregnant in the population). p0 is the claimed value for the null hypothesis. n is the sample size.
So let's say that there are women who go to the OBGYN each month and of them, a doctor claims that 80% of them are currently pregnant at the time of their visit. The population are women who go to the OBGYN and the women who are pregnant are the proportion of the population. The claim is that 80% (p=0.8) are pregnant when they visit. You suspect that the amount of women that are pregnant is less than this (< 0.8). Suppose for that 75 out of 100 women sampled were pregnant who went to the OBGYN office.
Realize that ṗ is equal to the the sample proportion which means in this case it is equal to,ṗ= 75/100= 0.75
Plugging these values into the formula, Z= (ṗ - p0)/√p0(1-p0)/n= (0.75- 0.8)/√(0.8)(1-0.8)/100= -1.25
Test Statistic for Two Population Proportions Calculator
The Test Statistic for Two Population Proportions Calculator calculates the test statistic when the variable being tested is categoritcal and you're interested in the proportion of individuals with a certain characteristic of 2 different categories such as gender (male/female). Let's say we're interested in studying people with sickle cell anemia; this is the certain proportion of the population that we want study. Unlike a single proportion population, we study both categories of this population instead of just one. With a single proportion population, we would study either the male or female population who have sickle cell anemia. With two population proportions, we study two populations or groups (such as males and females with sickle cell anemia).
In order to conduct this test, two separate random samples need to be selected, one from each population (in our case, males and females with sickle cell anemia).
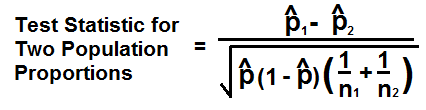
The formula to calculate the test statistic for two population proportions is, Z= ṗ1 - ṗ2/√ṗ(1-ṗ)(1/n1 + 1/n2)
ṗ1 and ṗ2 are the sample proportions. For each sample, the sample size is n1 and n2 (they don't need to be equal). ṗ is the pooled sampled proportion, which is the total number of individuals from both samples who have the characteristic of interest divided by the total number of individuals from both samples (n1 + n2).
So, as an example, let's say that there are a group of test takers. Out of the test takers, 8/241 who drank a lot of coffee before the test failed the exam. 4/220 who did not drink any coffee before the test failed the exam. Let's calculate the test statistic for the two population proportions.
Based on this example, the data is ṗ1= 8/241= 0.033, ṗ2= 4/206= 0.019, n1= 241, n2= 220, and ṗ= (4+8)/(141+206)= 12/347= 0.03458.
Plugging these values into the formula,
Z= ṗ1 - ṗ2/√ṗ(1-ṗ)(1/n1 + 1/n2)=
(0.033 - 0.019)/√0.03458(1-0.03458)(1/241 + 1/206)= 0.82
To use any of these calculators, a user simply enters in all of the various fields and the resultant test statistic will be shown below.
If you want to calculate the test statistic based on paired data samples, see our
Paired t-test Calculator
If you want to calculate the test statistic based on unpaired data samples, see our
Unpaired t-test Calculator
Related Resources
T-value Calculator
p-value Calculator
Hypothesis Testing Calculator
Variance Calculator
Standard Deviation Calculator
Expected Value Calculator
Z Score Calculator
Z Score to Raw Score Calculator
Chebyshev's Theorem Calculator
Binomial Coefficient Calculator
Bernoulli Trial Calculator
Area Under the Curve Calculator
Confidence Interval Calculator
Sample Size Calculator
Margin of Error Calculator
T-value Calculator
Regression Line Calculator
Slope and y-intercept of a Regression Line Calculator
R Squared Calculator (Coefficient of Determination)