
Unpaired t-test Calculator
Enter Up to 100 Unpaired Data Samples
This unpaired t-test calculator calculates the test statistic for a given set of unpaired data samples.
With this calculator, a user can enter up to 100 unpaired data samples.
Unlike the paired t-test, the unpaired t-test is not matched up, per se. Scientific experiments or trial-and-error research is often done by comparing two or more sets of data. Paired data is data that consists of the same subject such as before or after; for example, the same person pre-test and post-test. Or paired data is data that consists of subjects that are paired in some way, such as identical twins or students that have around the same reading ability, grades, test scores, etc. Unpaired or independent data is data that consists of separate individuals that aren't matched up in any particular way. In other words, unpaired data lacks a natural pairing.
Data that are not paired must be analyzed using the t-test for unpaired data. If the data are paired, the t-test for paired data should be used.
Paired data testing is more popular and used because it allows for more control. The subject is either the same person or people who are very closely matched by various metrics. Because of this, it eliminates a lot of variability that could exist between totally unpaired subjects. However, there are times when the unpaired t-test must be used, because life can be very random and place unpaired subjects against each other. Therefore, unpaired testing is also vital to do at times.
Unpaired testing is used when the variable is numerical in nature (for example, the height of a person or the weight of a person) and there is no natural or intentional pairing done by the researcher (such as matching up students with similar reading or math scores).
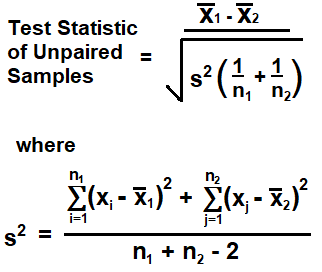
The formula to calculate the test statistic of unpaired data samples is,
s2 is the pooled standard deviation of the unpaired data samples. The pooled standard deviation represents the combined standard deviation for both sets of unpaired data samples.
n1 is the sample size for the first set (or group) of unpaired data samples.
n2 is the sample size for the second set (or group) of unpaired data samples.
To illustrate this, let's now go over an example of a unpaired t-test scenario.
We will strictly go over numbers here and how to do calculations to solve for the test statistic for the data set. It will be simple.
Let's say we have data for the money spent on transaction on a website for a laptop computer.
The data is shown in the table below.
| Group A | Group B |
| 10 | 20 |
| 50 | 60 |
| 100 |
With unpaired data samples, there can be different sample sizes among the data. As you can see, the first group has a sample size of 2, while the second group has a sample size of 3. With paired samples, the number of data points must be equal.
So, in order to calculate the test statistic from this data, there is a number of steps we must do.
The first thing we must do is find the mean for each data set.
For
For
We then have to calclate the pooled standard deviation. This is calculated by taking each value of each group and subtracting the mean of the group, then squaring each of these differences. We do this for the first group and then the second group, and then add up these values. After we divide this number by the the sample size of each of the groups added up together minus 2. This gives us a value of 1333.33.
We then take difference of the two means for each of the data sets and then divide this value by the square root of the pooled standard deviation multiplied by 1 over the sample size of the first data set plus 1 over the sample size of the second data set.
This gives us a test statistic of -0.90
The test statistic value is very important because we can then take this test statistic value and look up the p-value on a table or use a p-value calculator to find the p-value. The p-value is the probability that the null (or claimed) hypothesis is true. If the p-value is less than the significance level, then we can reject the null hypothesis. If the p-value is equal to or greater than the null hypothesis, then we cannot reject the null hypothesis.
If you need to find the p-value based on the test statistic obtained from this calculator, you can use our p-value calculator. This p-value calculator calculates the p-value based on the test statistic, the sample size, the type of hypothesis testing (left tail, right tail, or two-tail), and the significance level.
This is the value of the test statistic obtained here.
To use this calculator, you must enter unpaired values into the fields. Any field that does not have a value in the x or y fields will be ignored. As many as 100 paired data samples can be entered into this calculator.
To use our paired t-test calculator if you want to calculate the test statistic
of paired data samples, see our
paired t-test calculator.
Related Resources
Test Statistic Calculator
T-value Calculator
Expected Value Calculator
Z Score Calculator
Z Score to Raw Score Calculator
Chebyshev's Theorem Calculator
Binomial Coefficient Calculator
Bernoulli Trial Calculator
Area Under the Curve Calculator
Confidence Interval Calculator
Hypothesis Testing Calculator
Sample Correlation Coefficient Calculator
Regression Line Calculator
Slope and y-intercept of a Regression Line Calculator
Sample Size Calculator
Margin of Error for the Sample Mean Calculator
R Squared Calculator (Coefficient of Determination)