
Paired t-test Calculator
Enter Up to 100 Paired Data Samples
This paired t-test calculator calculates the test statistic for a given set of paired data samples.
With this calculator, a user can enter up to 100 paired data samples.
The paired t-test is used when the variable is numerical in nature (for example, the height of a person or the weight of a person) and the individuals in the sample are either paired up in some way (such as a husband and wife) or the same people are used twice (for example, preprocedure and postprocedure). Paired tests are used when you want to minimize the chance of the treatment and control groups being too different.
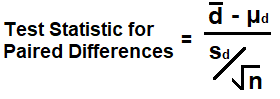
The formula to calculate the test statistic of paired data samples is,
μd is the population mean of all paired differences. When testing paired data, the null hypothesis is that μd is equal to 0, and the alternative hypothesis is that μd < 0, > 0, or ≠ 0.
sd is the standard deviation of of the paired differences.
The sample size is the number of paired data samples.
To illustrate this, let's now go over an example of a paired t-test scenario, which can be seen in real life.
Let's say that we are running a new prep class. This prep class is to prepare engineering students for the national board exam to become a professional engineer.
This is a brand new prep class that isn't established yet in terms of its teaching method. The person who runs this prep class wants to determine what is the best approach to train students so that they can get the highest score possible on the exam.
The prep instructor wants to determine if Textbook A or Textbook B is better at training students for the exam.
Therefore, the prep instructor subdivides the 20 trainees up into 2 groups, making 10 pairs. The pairs are matched up according to their grades, reading ability, study habits, etc so that it's relatively even between each group.
The first group will train for the exam using Textbook A.
The second group will train for the exam using Textbook B.
After the training occurs and the students have taken the board exam, the prep center are notified of all the grades that the students receive based on a previous agreement with the students that they would grant permission to the scores.
Let's say that the following table below are the scores of the students.
| Pair | Group using Textbook A | Group using Textbook B | Paired Difference |
| 1 | 87 | 80 | +7 |
| 2 | 90 | 85 | +5 |
| 3 | 93 | 96 | -3 |
| 4 | 75 | 75 | 0 |
| 5 | 98 | 94 | +4 |
| 6 | 81 | 86 | -5 |
| 7 | 89 | 93 | -4 |
| 8 | 80 | 77 | +3 |
| 9 | 97 | 91 | +6 |
| 10 | 86 | 79 | +7 |
So, as you can see, the data are in pairs.
With have similar subjects being compared (reading ability, grades, etc.), we want to see which textbook is better fit to train students to get higher scores on the board exam.
So we have our paired data samples from each group (the group studying with Textbook A vs the group studying with Textbook B). However, it's not the actual scores that we're interested in. The difference between the scores is actually what's important, because we're doing a comparison to see which group does better. Therefore, we get the paired difference for each paired data sample. This result can be negative or positive.
So these paired difference values now supersede the actual scores themselves, and this will be the new data we work with going forward.
If the methods are exactly equal, we should get a paired difference of 0. If textbook A is better, we should get a positive paired difference value. If textbook B is better, we should get a negative paired difference value.
So, in order to calculate the test statistic from this data, there is a number of steps we must do.
As we did above, we had to take the first value of the paired data sample and minus the second value from it. This gives us the paired difference. This is shown in the table above.
Next, we calculate the mean,
To calculate the mean, we take all the paired differences, add them together, and divide them by the number of paired data samples, which in this case is 10. This gives us, +20/10= +2. So our mean is +2.
Next, we get the standard deviation, sd, of the paired differences. This gives us a standard deviation of 4.64.
Next, we calculate the standard error, sd/√
Since μd is assumed to 0, then we simply take the mean,
So the test statistic value is 1.36.
The test statistic value is very important because we can then take this test statistic value and look up the p-value on a table or use a p-value calculator to find the p-value. The p-value is the probability that the null (or claimed) hypothesis is true. If the p-value is less than the significance level, then we can reject the null hypothesis. If the p-value is equal to or greater than the null hypothesis, then we cannot reject the null hypothesis.
If you need to find the p-value based on the test statistic obtained from this calculator, you can use our p-value calculator. This p-value calculator calculates the p-value based on the test statistic, the sample size, the type of hypothesis testing (left tail, right tail, or two-tail), and the significance level.
This is the value of the test statistic obtained here.
To use this calculator, you must enter a value into the x and y fields to complete a paired data field. Any field that does not have a value in the x and y fields will be ignored. As many as 100 paired data samples can be entered into this calculator.
To calculate the test statistic for unpaired sample data, see our
unpaired t-test Calculator
Related Resources
Test Statistic Calculator
T-value Calculator
Expected Value Calculator
Z Score Calculator
Z Score to Raw Score Calculator
Chebyshev's Theorem Calculator
Binomial Coefficient Calculator
Bernoulli Trial Calculator
Area Under the Curve Calculator
Confidence Interval Calculator
Hypothesis Testing Calculator
Sample Correlation Coefficient Calculator
Regression Line Calculator
Slope and y-intercept of a Regression Line Calculator
Sample Size Calculator
Margin of Error for the Sample Mean Calculator
R Squared Calculator (Coefficient of Determination)